Jamaican vs Spaniard Unemployment Among Ages 20 to 24 years
COMPARE
Jamaican
Spaniard
Unemployment Among Ages 20 to 24 years
Unemployment Among Ages 20 to 24 years Comparison
Jamaicans
Spaniards
12.6%
UNEMPLOYMENT AMONG AGES 20 TO 24 YEARS
0.0/ 100
METRIC RATING
310th/ 347
METRIC RANK
10.3%
UNEMPLOYMENT AMONG AGES 20 TO 24 YEARS
63.4/ 100
METRIC RATING
160th/ 347
METRIC RANK
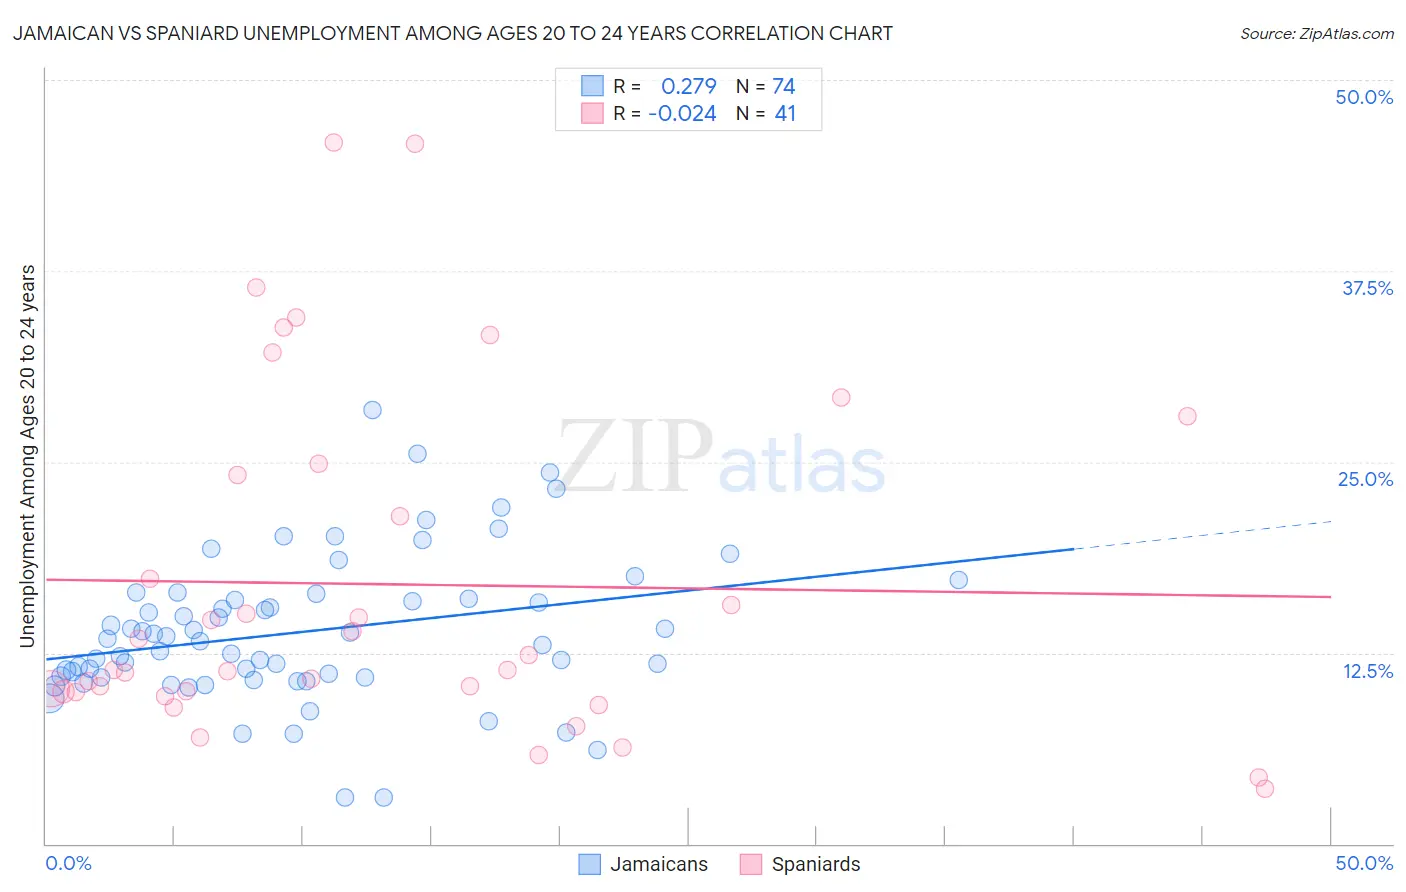
Jamaican vs Spaniard Unemployment Among Ages 20 to 24 years Correlation Chart
The statistical analysis conducted on geographies consisting of 359,144,305 people shows a weak positive correlation between the proportion of Jamaicans and unemployment rate among population between the ages 20 and 24 in the United States with a correlation coefficient (R) of 0.279 and weighted average of 12.6%. Similarly, the statistical analysis conducted on geographies consisting of 426,815,465 people shows no correlation between the proportion of Spaniards and unemployment rate among population between the ages 20 and 24 in the United States with a correlation coefficient (R) of -0.024 and weighted average of 10.3%, a difference of 22.5%.
Unemployment Among Ages 20 to 24 years Correlation Summary
| Measurement | Jamaican | Spaniard |
| Minimum | 3.0% | 3.6% |
| Maximum | 28.4% | 45.9% |
| Range | 25.4% | 42.3% |
| Mean | 13.9% | 17.0% |
| Median | 13.4% | 11.4% |
| Interquartile 25% (IQ1) | 10.9% | 9.9% |
| Interquartile 75% (IQ3) | 16.0% | 24.5% |
| Interquartile Range (IQR) | 5.1% | 14.6% |
| Standard Deviation (Sample) | 4.8% | 11.2% |
| Standard Deviation (Population) | 4.7% | 11.1% |
Similar Demographics by Unemployment Among Ages 20 to 24 years
Demographics Similar to Jamaicans by Unemployment Among Ages 20 to 24 years
In terms of unemployment among ages 20 to 24 years, the demographic groups most similar to Jamaicans are Immigrants from Bangladesh (12.6%, a difference of 0.12%), Tohono O'odham (12.5%, a difference of 0.20%), Vietnamese (12.6%, a difference of 0.44%), Houma (12.6%, a difference of 0.59%), and Bermudan (12.5%, a difference of 0.89%).
| Demographics | Rating | Rank | Unemployment Among Ages 20 to 24 years |
| Haitians | 0.0 /100 | #303 | Tragic 12.2% |
| Immigrants | West Indies | 0.0 /100 | #304 | Tragic 12.3% |
| Chippewa | 0.0 /100 | #305 | Tragic 12.3% |
| Immigrants | Haiti | 0.0 /100 | #306 | Tragic 12.4% |
| Bermudans | 0.0 /100 | #307 | Tragic 12.5% |
| Tohono O'odham | 0.0 /100 | #308 | Tragic 12.5% |
| Immigrants | Bangladesh | 0.0 /100 | #309 | Tragic 12.6% |
| Jamaicans | 0.0 /100 | #310 | Tragic 12.6% |
| Vietnamese | 0.0 /100 | #311 | Tragic 12.6% |
| Houma | 0.0 /100 | #312 | Tragic 12.6% |
| Shoshone | 0.0 /100 | #313 | Tragic 12.7% |
| Blacks/African Americans | 0.0 /100 | #314 | Tragic 12.7% |
| West Indians | 0.0 /100 | #315 | Tragic 12.8% |
| Immigrants | Dominica | 0.0 /100 | #316 | Tragic 12.8% |
| Immigrants | Trinidad and Tobago | 0.0 /100 | #317 | Tragic 12.8% |
Demographics Similar to Spaniards by Unemployment Among Ages 20 to 24 years
In terms of unemployment among ages 20 to 24 years, the demographic groups most similar to Spaniards are Immigrants from England (10.3%, a difference of 0.010%), Indian (Asian) (10.3%, a difference of 0.030%), Immigrants from Kazakhstan (10.2%, a difference of 0.080%), Immigrants from Asia (10.3%, a difference of 0.080%), and Immigrants from Uganda (10.2%, a difference of 0.090%).
| Demographics | Rating | Rank | Unemployment Among Ages 20 to 24 years |
| Immigrants | Taiwan | 71.4 /100 | #153 | Good 10.2% |
| Immigrants | Switzerland | 71.3 /100 | #154 | Good 10.2% |
| Lithuanians | 70.0 /100 | #155 | Good 10.2% |
| Canadians | 66.7 /100 | #156 | Good 10.2% |
| Immigrants | Uganda | 65.6 /100 | #157 | Good 10.2% |
| Immigrants | Kazakhstan | 65.5 /100 | #158 | Good 10.2% |
| Immigrants | England | 63.7 /100 | #159 | Good 10.3% |
| Spaniards | 63.4 /100 | #160 | Good 10.3% |
| Indians (Asian) | 62.6 /100 | #161 | Good 10.3% |
| Immigrants | Asia | 61.3 /100 | #162 | Good 10.3% |
| Estonians | 61.1 /100 | #163 | Good 10.3% |
| Immigrants | Korea | 59.0 /100 | #164 | Average 10.3% |
| Lebanese | 58.3 /100 | #165 | Average 10.3% |
| Italians | 57.7 /100 | #166 | Average 10.3% |
| Immigrants | Fiji | 57.6 /100 | #167 | Average 10.3% |