Jamaican vs Immigrants from Bangladesh Female Unemployment
COMPARE
Jamaican
Immigrants from Bangladesh
Female Unemployment
Female Unemployment Comparison
Jamaicans
Immigrants from Bangladesh
6.1%
FEMALE UNEMPLOYMENT
0.0/ 100
METRIC RATING
298th/ 347
METRIC RANK
6.5%
FEMALE UNEMPLOYMENT
0.0/ 100
METRIC RATING
319th/ 347
METRIC RANK
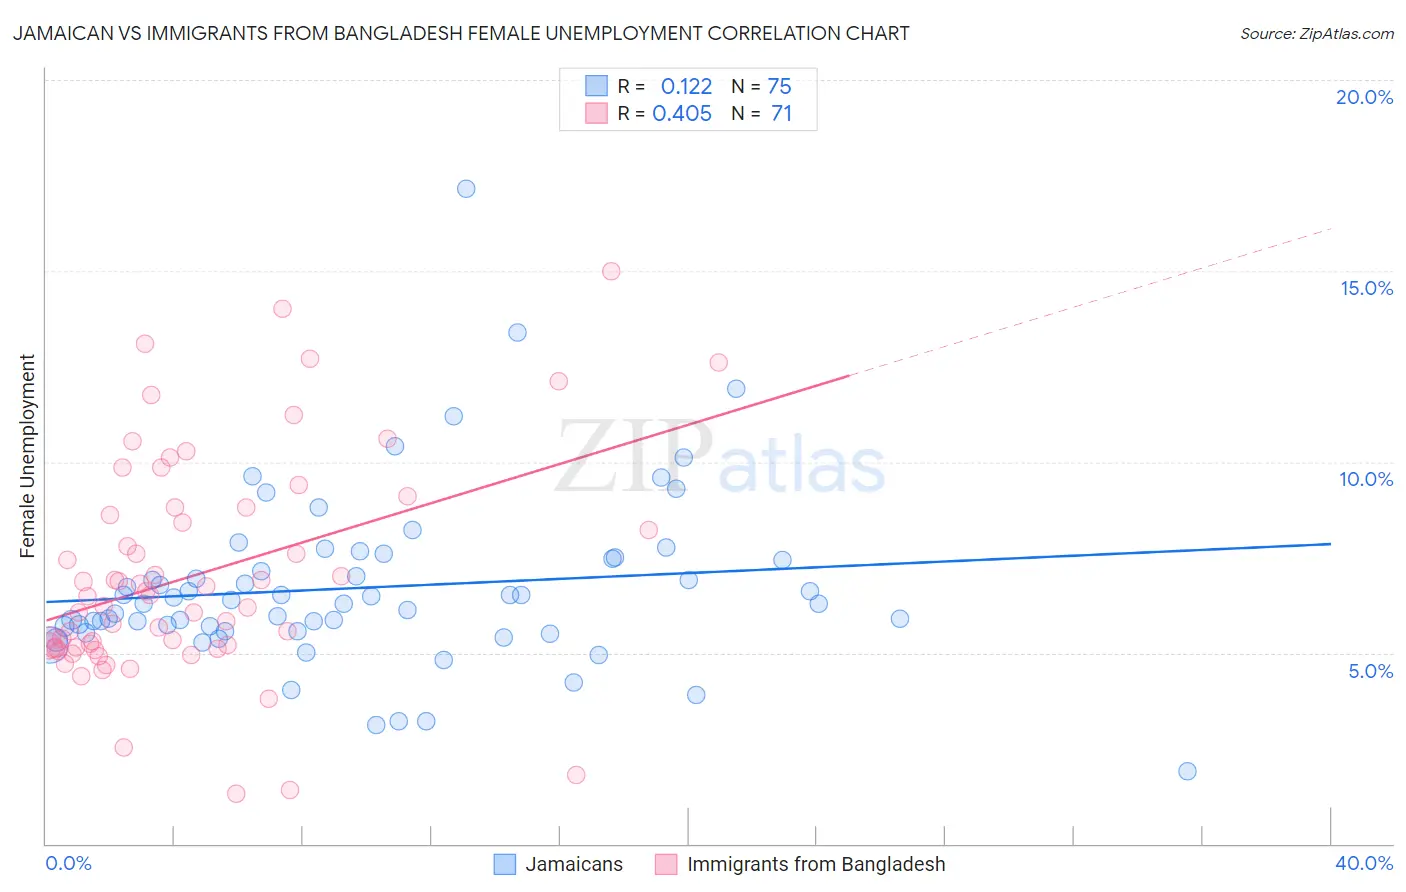
Jamaican vs Immigrants from Bangladesh Female Unemployment Correlation Chart
The statistical analysis conducted on geographies consisting of 366,799,566 people shows a poor positive correlation between the proportion of Jamaicans and unemploymnet rate among females in the United States with a correlation coefficient (R) of 0.122 and weighted average of 6.1%. Similarly, the statistical analysis conducted on geographies consisting of 203,458,285 people shows a moderate positive correlation between the proportion of Immigrants from Bangladesh and unemploymnet rate among females in the United States with a correlation coefficient (R) of 0.405 and weighted average of 6.5%, a difference of 5.4%.
Female Unemployment Correlation Summary
| Measurement | Jamaican | Immigrants from Bangladesh |
| Minimum | 1.9% | 1.3% |
| Maximum | 17.2% | 15.0% |
| Range | 15.3% | 13.7% |
| Mean | 6.7% | 7.0% |
| Median | 6.3% | 6.5% |
| Interquartile 25% (IQ1) | 5.6% | 5.1% |
| Interquartile 75% (IQ3) | 7.5% | 8.8% |
| Interquartile Range (IQR) | 1.9% | 3.7% |
| Standard Deviation (Sample) | 2.3% | 2.9% |
| Standard Deviation (Population) | 2.3% | 2.9% |
Similar Demographics by Female Unemployment
Demographics Similar to Jamaicans by Female Unemployment
In terms of female unemployment, the demographic groups most similar to Jamaicans are West Indian (6.1%, a difference of 0.020%), Alaskan Athabascan (6.1%, a difference of 0.030%), Immigrants from Latin America (6.1%, a difference of 0.050%), Ute (6.1%, a difference of 0.10%), and Immigrants from Haiti (6.1%, a difference of 0.15%).
| Demographics | Rating | Rank | Female Unemployment |
| Immigrants | West Indies | 0.0 /100 | #291 | Tragic 6.1% |
| Immigrants | Trinidad and Tobago | 0.0 /100 | #292 | Tragic 6.1% |
| Mexicans | 0.0 /100 | #293 | Tragic 6.1% |
| Immigrants | El Salvador | 0.0 /100 | #294 | Tragic 6.1% |
| Immigrants | Latin America | 0.0 /100 | #295 | Tragic 6.1% |
| Alaskan Athabascans | 0.0 /100 | #296 | Tragic 6.1% |
| West Indians | 0.0 /100 | #297 | Tragic 6.1% |
| Jamaicans | 0.0 /100 | #298 | Tragic 6.1% |
| Ute | 0.0 /100 | #299 | Tragic 6.1% |
| Immigrants | Haiti | 0.0 /100 | #300 | Tragic 6.1% |
| Immigrants | Barbados | 0.0 /100 | #301 | Tragic 6.2% |
| U.S. Virgin Islanders | 0.0 /100 | #302 | Tragic 6.2% |
| Barbadians | 0.0 /100 | #303 | Tragic 6.2% |
| Immigrants | Jamaica | 0.0 /100 | #304 | Tragic 6.2% |
| Spanish American Indians | 0.0 /100 | #305 | Tragic 6.2% |
Demographics Similar to Immigrants from Bangladesh by Female Unemployment
In terms of female unemployment, the demographic groups most similar to Immigrants from Bangladesh are Immigrants from Dominica (6.5%, a difference of 0.010%), British West Indian (6.4%, a difference of 0.19%), Immigrants from St. Vincent and the Grenadines (6.4%, a difference of 0.47%), Black/African American (6.5%, a difference of 0.55%), and Vietnamese (6.5%, a difference of 0.63%).
| Demographics | Rating | Rank | Female Unemployment |
| Immigrants | Grenada | 0.0 /100 | #312 | Tragic 6.3% |
| Belizeans | 0.0 /100 | #313 | Tragic 6.3% |
| Immigrants | Ecuador | 0.0 /100 | #314 | Tragic 6.4% |
| Pueblo | 0.0 /100 | #315 | Tragic 6.4% |
| Houma | 0.0 /100 | #316 | Tragic 6.4% |
| Immigrants | St. Vincent and the Grenadines | 0.0 /100 | #317 | Tragic 6.4% |
| British West Indians | 0.0 /100 | #318 | Tragic 6.4% |
| Immigrants | Bangladesh | 0.0 /100 | #319 | Tragic 6.5% |
| Immigrants | Dominica | 0.0 /100 | #320 | Tragic 6.5% |
| Blacks/African Americans | 0.0 /100 | #321 | Tragic 6.5% |
| Vietnamese | 0.0 /100 | #322 | Tragic 6.5% |
| Immigrants | Belize | 0.0 /100 | #323 | Tragic 6.5% |
| Cheyenne | 0.0 /100 | #324 | Tragic 6.6% |
| Apache | 0.0 /100 | #325 | Tragic 6.6% |
| Natives/Alaskans | 0.0 /100 | #326 | Tragic 6.6% |