Jamaican vs Immigrants from Bulgaria Female Unemployment
COMPARE
Jamaican
Immigrants from Bulgaria
Female Unemployment
Female Unemployment Comparison
Jamaicans
Immigrants from Bulgaria
6.1%
FEMALE UNEMPLOYMENT
0.0/ 100
METRIC RATING
298th/ 347
METRIC RANK
4.9%
FEMALE UNEMPLOYMENT
99.3/ 100
METRIC RATING
46th/ 347
METRIC RANK
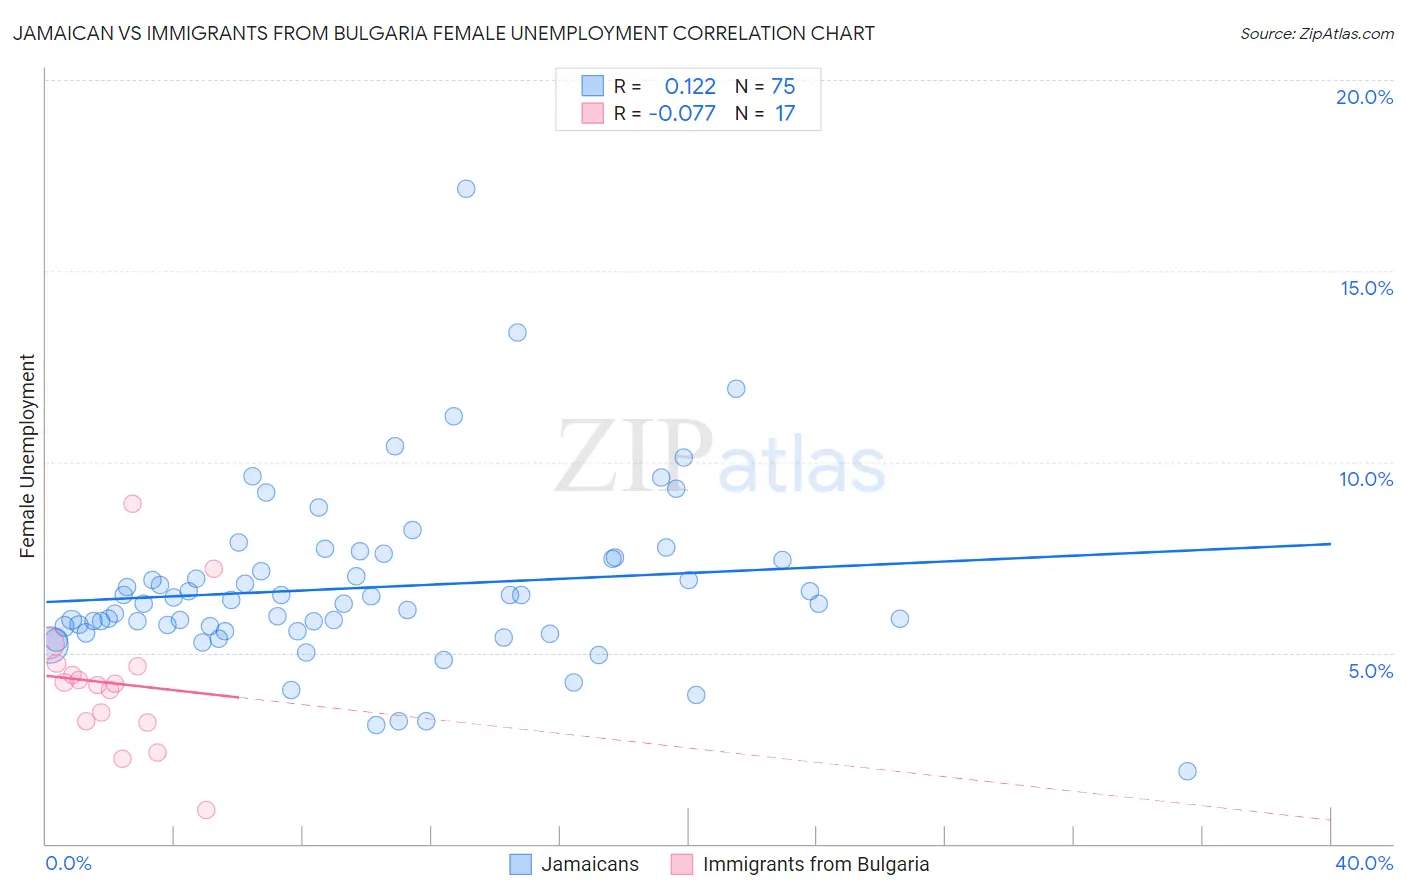
Jamaican vs Immigrants from Bulgaria Female Unemployment Correlation Chart
The statistical analysis conducted on geographies consisting of 366,799,566 people shows a poor positive correlation between the proportion of Jamaicans and unemploymnet rate among females in the United States with a correlation coefficient (R) of 0.122 and weighted average of 6.1%. Similarly, the statistical analysis conducted on geographies consisting of 172,394,252 people shows a slight negative correlation between the proportion of Immigrants from Bulgaria and unemploymnet rate among females in the United States with a correlation coefficient (R) of -0.077 and weighted average of 4.9%, a difference of 25.9%.
Female Unemployment Correlation Summary
| Measurement | Jamaican | Immigrants from Bulgaria |
| Minimum | 1.9% | 0.90% |
| Maximum | 17.2% | 8.9% |
| Range | 15.3% | 8.0% |
| Mean | 6.7% | 4.2% |
| Median | 6.3% | 4.2% |
| Interquartile 25% (IQ1) | 5.6% | 3.2% |
| Interquartile 75% (IQ3) | 7.5% | 4.7% |
| Interquartile Range (IQR) | 1.9% | 1.5% |
| Standard Deviation (Sample) | 2.3% | 1.8% |
| Standard Deviation (Population) | 2.3% | 1.8% |
Similar Demographics by Female Unemployment
Demographics Similar to Jamaicans by Female Unemployment
In terms of female unemployment, the demographic groups most similar to Jamaicans are West Indian (6.1%, a difference of 0.020%), Alaskan Athabascan (6.1%, a difference of 0.030%), Immigrants from Latin America (6.1%, a difference of 0.050%), Ute (6.1%, a difference of 0.10%), and Immigrants from Haiti (6.1%, a difference of 0.15%).
| Demographics | Rating | Rank | Female Unemployment |
| Immigrants | West Indies | 0.0 /100 | #291 | Tragic 6.1% |
| Immigrants | Trinidad and Tobago | 0.0 /100 | #292 | Tragic 6.1% |
| Mexicans | 0.0 /100 | #293 | Tragic 6.1% |
| Immigrants | El Salvador | 0.0 /100 | #294 | Tragic 6.1% |
| Immigrants | Latin America | 0.0 /100 | #295 | Tragic 6.1% |
| Alaskan Athabascans | 0.0 /100 | #296 | Tragic 6.1% |
| West Indians | 0.0 /100 | #297 | Tragic 6.1% |
| Jamaicans | 0.0 /100 | #298 | Tragic 6.1% |
| Ute | 0.0 /100 | #299 | Tragic 6.1% |
| Immigrants | Haiti | 0.0 /100 | #300 | Tragic 6.1% |
| Immigrants | Barbados | 0.0 /100 | #301 | Tragic 6.2% |
| U.S. Virgin Islanders | 0.0 /100 | #302 | Tragic 6.2% |
| Barbadians | 0.0 /100 | #303 | Tragic 6.2% |
| Immigrants | Jamaica | 0.0 /100 | #304 | Tragic 6.2% |
| Spanish American Indians | 0.0 /100 | #305 | Tragic 6.2% |
Demographics Similar to Immigrants from Bulgaria by Female Unemployment
In terms of female unemployment, the demographic groups most similar to Immigrants from Bulgaria are Austrian (4.9%, a difference of 0.030%), Okinawan (4.9%, a difference of 0.080%), Greek (4.9%, a difference of 0.10%), Eastern European (4.9%, a difference of 0.21%), and Thai (4.9%, a difference of 0.29%).
| Demographics | Rating | Rank | Female Unemployment |
| Scotch-Irish | 99.6 /100 | #39 | Exceptional 4.8% |
| French | 99.6 /100 | #40 | Exceptional 4.8% |
| Tongans | 99.5 /100 | #41 | Exceptional 4.8% |
| Italians | 99.5 /100 | #42 | Exceptional 4.8% |
| Eastern Europeans | 99.4 /100 | #43 | Exceptional 4.9% |
| Greeks | 99.4 /100 | #44 | Exceptional 4.9% |
| Austrians | 99.3 /100 | #45 | Exceptional 4.9% |
| Immigrants | Bulgaria | 99.3 /100 | #46 | Exceptional 4.9% |
| Okinawans | 99.3 /100 | #47 | Exceptional 4.9% |
| Thais | 99.2 /100 | #48 | Exceptional 4.9% |
| Australians | 99.2 /100 | #49 | Exceptional 4.9% |
| Immigrants | Cuba | 99.1 /100 | #50 | Exceptional 4.9% |
| Cambodians | 99.1 /100 | #51 | Exceptional 4.9% |
| Slavs | 99.1 /100 | #52 | Exceptional 4.9% |
| Whites/Caucasians | 99.0 /100 | #53 | Exceptional 4.9% |