Ukrainian vs Immigrants from Bangladesh Female Unemployment
COMPARE
Ukrainian
Immigrants from Bangladesh
Female Unemployment
Female Unemployment Comparison
Ukrainians
Immigrants from Bangladesh
5.0%
FEMALE UNEMPLOYMENT
97.1/ 100
METRIC RATING
85th/ 347
METRIC RANK
6.5%
FEMALE UNEMPLOYMENT
0.0/ 100
METRIC RATING
319th/ 347
METRIC RANK
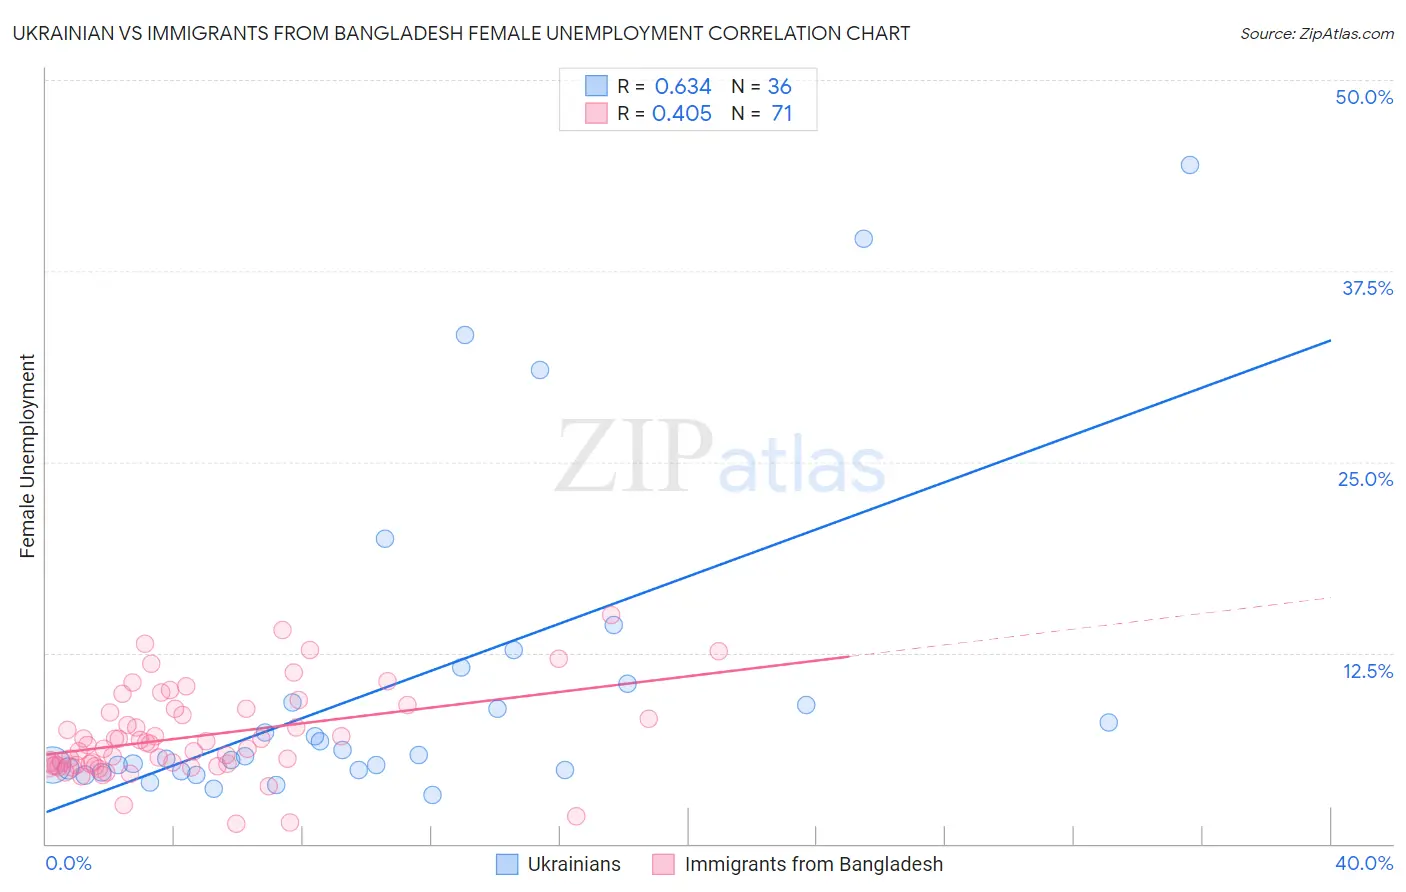
Ukrainian vs Immigrants from Bangladesh Female Unemployment Correlation Chart
The statistical analysis conducted on geographies consisting of 444,684,772 people shows a significant positive correlation between the proportion of Ukrainians and unemploymnet rate among females in the United States with a correlation coefficient (R) of 0.634 and weighted average of 5.0%. Similarly, the statistical analysis conducted on geographies consisting of 203,458,285 people shows a moderate positive correlation between the proportion of Immigrants from Bangladesh and unemploymnet rate among females in the United States with a correlation coefficient (R) of 0.405 and weighted average of 6.5%, a difference of 29.6%.
Female Unemployment Correlation Summary
| Measurement | Ukrainian | Immigrants from Bangladesh |
| Minimum | 3.2% | 1.3% |
| Maximum | 44.4% | 15.0% |
| Range | 41.2% | 13.7% |
| Mean | 10.3% | 7.0% |
| Median | 5.8% | 6.5% |
| Interquartile 25% (IQ1) | 4.8% | 5.1% |
| Interquartile 75% (IQ3) | 9.9% | 8.8% |
| Interquartile Range (IQR) | 5.1% | 3.7% |
| Standard Deviation (Sample) | 10.3% | 2.9% |
| Standard Deviation (Population) | 10.2% | 2.9% |
Similar Demographics by Female Unemployment
Demographics Similar to Ukrainians by Female Unemployment
In terms of female unemployment, the demographic groups most similar to Ukrainians are Bolivian (5.0%, a difference of 0.010%), Canadian (5.0%, a difference of 0.040%), Immigrants from Serbia (5.0%, a difference of 0.080%), Immigrants from Australia (5.0%, a difference of 0.090%), and Venezuelan (5.0%, a difference of 0.10%).
| Demographics | Rating | Rank | Female Unemployment |
| Immigrants | Netherlands | 97.8 /100 | #78 | Exceptional 5.0% |
| Turks | 97.6 /100 | #79 | Exceptional 5.0% |
| New Zealanders | 97.4 /100 | #80 | Exceptional 5.0% |
| Filipinos | 97.3 /100 | #81 | Exceptional 5.0% |
| Immigrants | Australia | 97.3 /100 | #82 | Exceptional 5.0% |
| Immigrants | Serbia | 97.2 /100 | #83 | Exceptional 5.0% |
| Canadians | 97.2 /100 | #84 | Exceptional 5.0% |
| Ukrainians | 97.1 /100 | #85 | Exceptional 5.0% |
| Bolivians | 97.1 /100 | #86 | Exceptional 5.0% |
| Venezuelans | 96.9 /100 | #87 | Exceptional 5.0% |
| Immigrants | Sudan | 96.7 /100 | #88 | Exceptional 5.0% |
| Immigrants | Taiwan | 96.6 /100 | #89 | Exceptional 5.0% |
| Immigrants | Sweden | 96.3 /100 | #90 | Exceptional 5.0% |
| Immigrants | Japan | 96.0 /100 | #91 | Exceptional 5.0% |
| Romanians | 95.9 /100 | #92 | Exceptional 5.0% |
Demographics Similar to Immigrants from Bangladesh by Female Unemployment
In terms of female unemployment, the demographic groups most similar to Immigrants from Bangladesh are Immigrants from Dominica (6.5%, a difference of 0.010%), British West Indian (6.4%, a difference of 0.19%), Immigrants from St. Vincent and the Grenadines (6.4%, a difference of 0.47%), Black/African American (6.5%, a difference of 0.55%), and Vietnamese (6.5%, a difference of 0.63%).
| Demographics | Rating | Rank | Female Unemployment |
| Immigrants | Grenada | 0.0 /100 | #312 | Tragic 6.3% |
| Belizeans | 0.0 /100 | #313 | Tragic 6.3% |
| Immigrants | Ecuador | 0.0 /100 | #314 | Tragic 6.4% |
| Pueblo | 0.0 /100 | #315 | Tragic 6.4% |
| Houma | 0.0 /100 | #316 | Tragic 6.4% |
| Immigrants | St. Vincent and the Grenadines | 0.0 /100 | #317 | Tragic 6.4% |
| British West Indians | 0.0 /100 | #318 | Tragic 6.4% |
| Immigrants | Bangladesh | 0.0 /100 | #319 | Tragic 6.5% |
| Immigrants | Dominica | 0.0 /100 | #320 | Tragic 6.5% |
| Blacks/African Americans | 0.0 /100 | #321 | Tragic 6.5% |
| Vietnamese | 0.0 /100 | #322 | Tragic 6.5% |
| Immigrants | Belize | 0.0 /100 | #323 | Tragic 6.5% |
| Cheyenne | 0.0 /100 | #324 | Tragic 6.6% |
| Apache | 0.0 /100 | #325 | Tragic 6.6% |
| Natives/Alaskans | 0.0 /100 | #326 | Tragic 6.6% |