English vs Immigrants from Bangladesh Female Unemployment
COMPARE
English
Immigrants from Bangladesh
Female Unemployment
Female Unemployment Comparison
English
Immigrants from Bangladesh
4.6%
FEMALE UNEMPLOYMENT
100.0/ 100
METRIC RATING
15th/ 347
METRIC RANK
6.5%
FEMALE UNEMPLOYMENT
0.0/ 100
METRIC RATING
319th/ 347
METRIC RANK
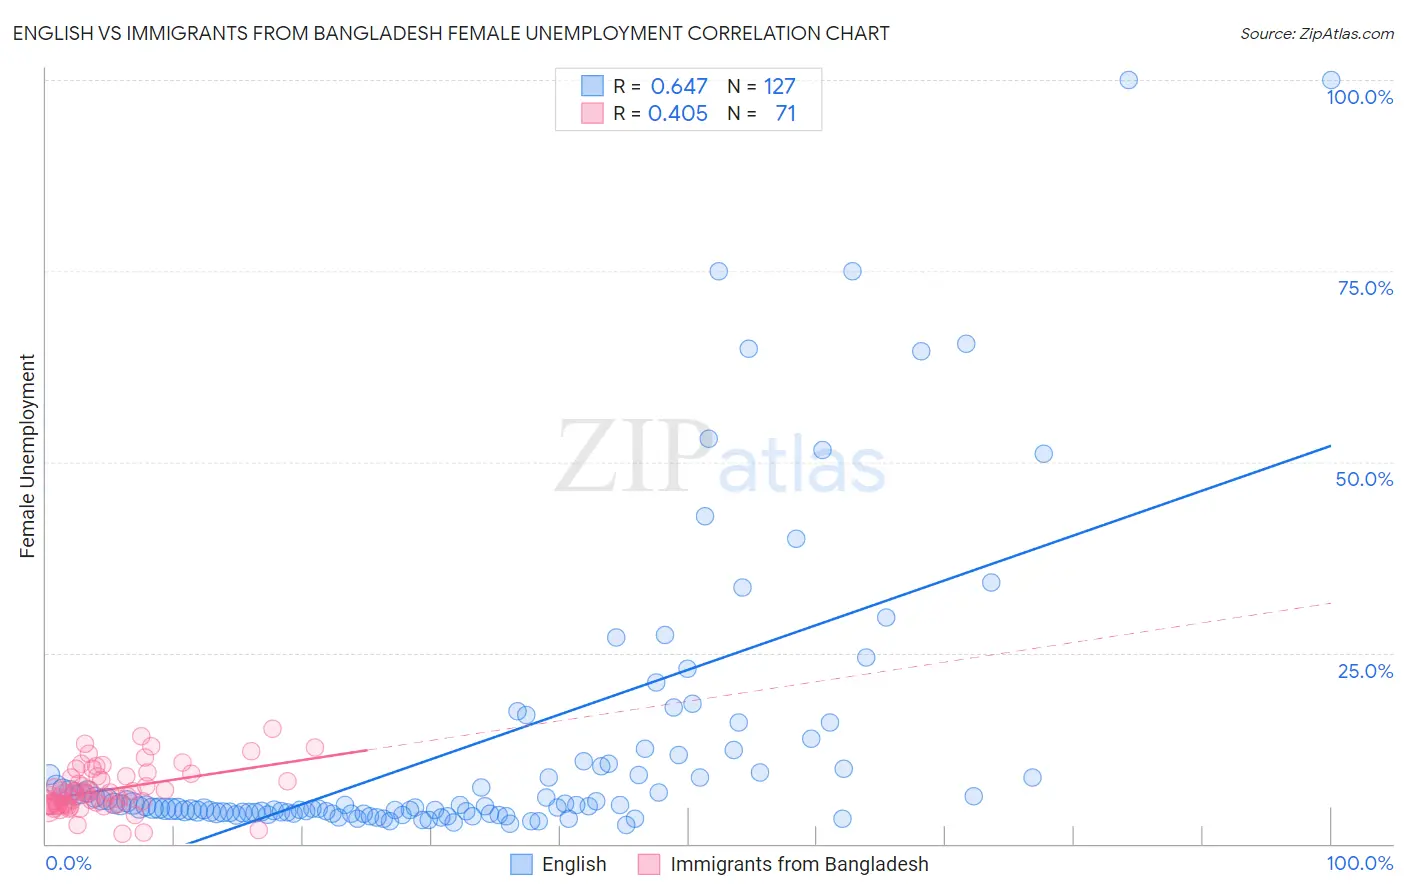
English vs Immigrants from Bangladesh Female Unemployment Correlation Chart
The statistical analysis conducted on geographies consisting of 563,002,519 people shows a significant positive correlation between the proportion of English and unemploymnet rate among females in the United States with a correlation coefficient (R) of 0.647 and weighted average of 4.6%. Similarly, the statistical analysis conducted on geographies consisting of 203,458,285 people shows a moderate positive correlation between the proportion of Immigrants from Bangladesh and unemploymnet rate among females in the United States with a correlation coefficient (R) of 0.405 and weighted average of 6.5%, a difference of 39.3%.
Female Unemployment Correlation Summary
| Measurement | English | Immigrants from Bangladesh |
| Minimum | 2.5% | 1.3% |
| Maximum | 100.0% | 15.0% |
| Range | 97.5% | 13.7% |
| Mean | 12.9% | 7.0% |
| Median | 5.0% | 6.5% |
| Interquartile 25% (IQ1) | 4.1% | 5.1% |
| Interquartile 75% (IQ3) | 10.5% | 8.8% |
| Interquartile Range (IQR) | 6.4% | 3.7% |
| Standard Deviation (Sample) | 19.0% | 2.9% |
| Standard Deviation (Population) | 18.9% | 2.9% |
Similar Demographics by Female Unemployment
Demographics Similar to English by Female Unemployment
In terms of female unemployment, the demographic groups most similar to English are Finnish (4.6%, a difference of 0.20%), Belgian (4.6%, a difference of 0.79%), Carpatho Rusyn (4.7%, a difference of 0.85%), Croatian (4.7%, a difference of 0.87%), and Dutch (4.6%, a difference of 0.94%).
| Demographics | Rating | Rank | Female Unemployment |
| Germans | 100.0 /100 | #8 | Exceptional 4.5% |
| Slovenes | 100.0 /100 | #9 | Exceptional 4.5% |
| Swiss | 100.0 /100 | #10 | Exceptional 4.6% |
| Scandinavians | 100.0 /100 | #11 | Exceptional 4.6% |
| Dutch | 100.0 /100 | #12 | Exceptional 4.6% |
| Belgians | 100.0 /100 | #13 | Exceptional 4.6% |
| Finns | 100.0 /100 | #14 | Exceptional 4.6% |
| English | 100.0 /100 | #15 | Exceptional 4.6% |
| Carpatho Rusyns | 99.9 /100 | #16 | Exceptional 4.7% |
| Croatians | 99.9 /100 | #17 | Exceptional 4.7% |
| Latvians | 99.9 /100 | #18 | Exceptional 4.7% |
| Poles | 99.9 /100 | #19 | Exceptional 4.7% |
| Bulgarians | 99.9 /100 | #20 | Exceptional 4.7% |
| Fijians | 99.9 /100 | #21 | Exceptional 4.7% |
| Europeans | 99.9 /100 | #22 | Exceptional 4.7% |
Demographics Similar to Immigrants from Bangladesh by Female Unemployment
In terms of female unemployment, the demographic groups most similar to Immigrants from Bangladesh are Immigrants from Dominica (6.5%, a difference of 0.010%), British West Indian (6.4%, a difference of 0.19%), Immigrants from St. Vincent and the Grenadines (6.4%, a difference of 0.47%), Black/African American (6.5%, a difference of 0.55%), and Vietnamese (6.5%, a difference of 0.63%).
| Demographics | Rating | Rank | Female Unemployment |
| Immigrants | Grenada | 0.0 /100 | #312 | Tragic 6.3% |
| Belizeans | 0.0 /100 | #313 | Tragic 6.3% |
| Immigrants | Ecuador | 0.0 /100 | #314 | Tragic 6.4% |
| Pueblo | 0.0 /100 | #315 | Tragic 6.4% |
| Houma | 0.0 /100 | #316 | Tragic 6.4% |
| Immigrants | St. Vincent and the Grenadines | 0.0 /100 | #317 | Tragic 6.4% |
| British West Indians | 0.0 /100 | #318 | Tragic 6.4% |
| Immigrants | Bangladesh | 0.0 /100 | #319 | Tragic 6.5% |
| Immigrants | Dominica | 0.0 /100 | #320 | Tragic 6.5% |
| Blacks/African Americans | 0.0 /100 | #321 | Tragic 6.5% |
| Vietnamese | 0.0 /100 | #322 | Tragic 6.5% |
| Immigrants | Belize | 0.0 /100 | #323 | Tragic 6.5% |
| Cheyenne | 0.0 /100 | #324 | Tragic 6.6% |
| Apache | 0.0 /100 | #325 | Tragic 6.6% |
| Natives/Alaskans | 0.0 /100 | #326 | Tragic 6.6% |