Israeli vs Chilean Unemployment Among Women with Children Ages 6 to 17 years
COMPARE
Israeli
Chilean
Unemployment Among Women with Children Ages 6 to 17 years
Unemployment Among Women with Children Ages 6 to 17 years Comparison
Israelis
Chileans
8.7%
UNEMPLOYMENT AMONG WOMEN WITH CHILDREN AGES 6 TO 17 YEARS
95.9/ 100
METRIC RATING
120th/ 347
METRIC RANK
8.8%
UNEMPLOYMENT AMONG WOMEN WITH CHILDREN AGES 6 TO 17 YEARS
80.8/ 100
METRIC RATING
146th/ 347
METRIC RANK
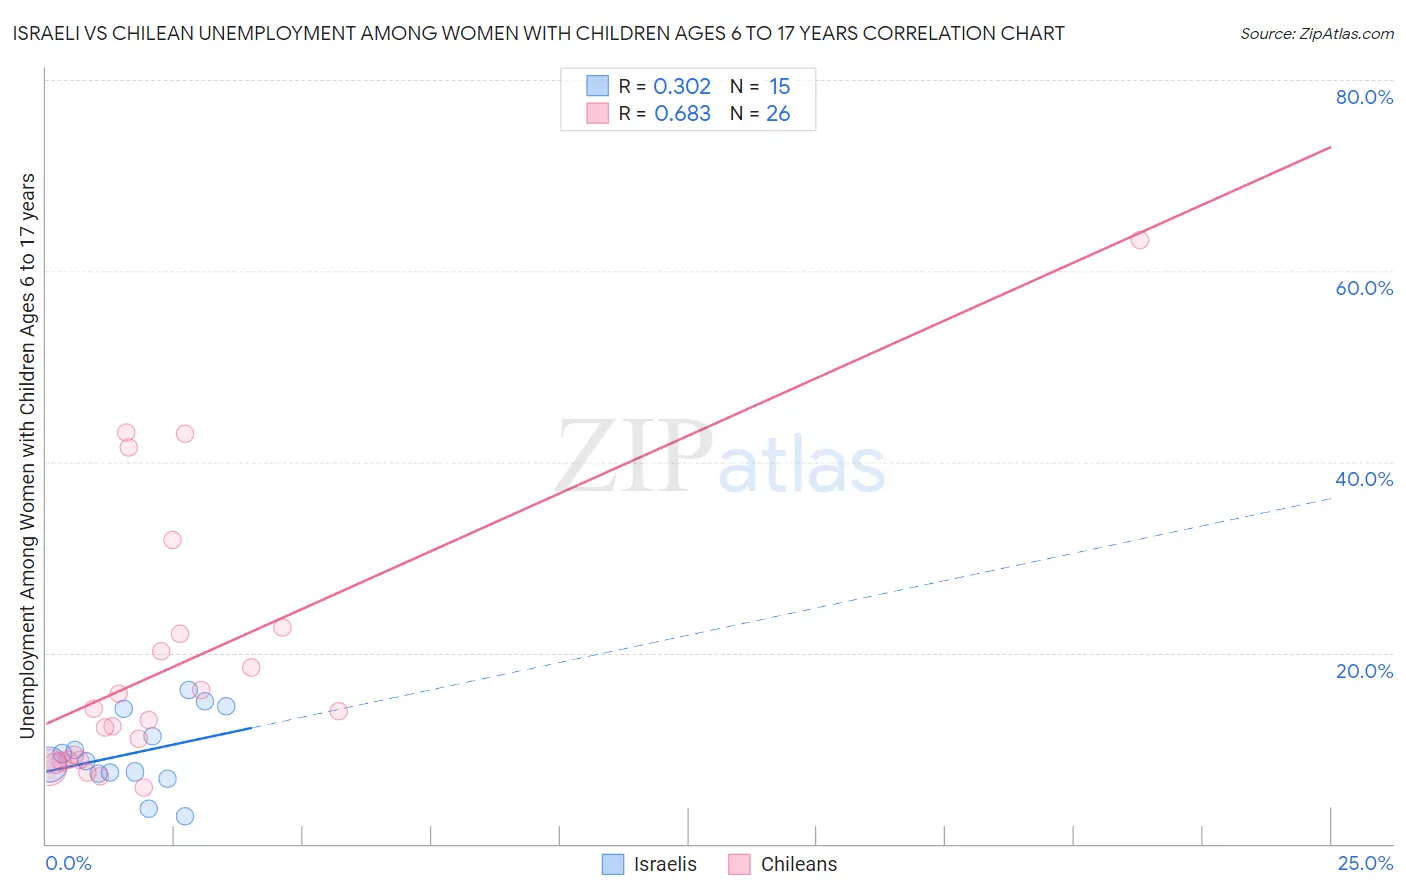
Israeli vs Chilean Unemployment Among Women with Children Ages 6 to 17 years Correlation Chart
The statistical analysis conducted on geographies consisting of 167,871,710 people shows a mild positive correlation between the proportion of Israelis and unemployment rate among women with children between the ages 6 and 17 in the United States with a correlation coefficient (R) of 0.302 and weighted average of 8.7%. Similarly, the statistical analysis conducted on geographies consisting of 201,180,902 people shows a significant positive correlation between the proportion of Chileans and unemployment rate among women with children between the ages 6 and 17 in the United States with a correlation coefficient (R) of 0.683 and weighted average of 8.8%, a difference of 2.0%.
Unemployment Among Women with Children Ages 6 to 17 years Correlation Summary
| Measurement | Israeli | Chilean |
| Minimum | 2.8% | 5.9% |
| Maximum | 16.1% | 63.2% |
| Range | 13.3% | 57.3% |
| Mean | 9.5% | 18.7% |
| Median | 8.7% | 13.4% |
| Interquartile 25% (IQ1) | 7.4% | 8.8% |
| Interquartile 75% (IQ3) | 14.2% | 22.0% |
| Interquartile Range (IQR) | 6.8% | 13.2% |
| Standard Deviation (Sample) | 4.0% | 14.4% |
| Standard Deviation (Population) | 3.8% | 14.1% |
Similar Demographics by Unemployment Among Women with Children Ages 6 to 17 years
Demographics Similar to Israelis by Unemployment Among Women with Children Ages 6 to 17 years
In terms of unemployment among women with children ages 6 to 17 years, the demographic groups most similar to Israelis are Immigrants from Grenada (8.6%, a difference of 0.080%), Pueblo (8.6%, a difference of 0.090%), Immigrants from Denmark (8.7%, a difference of 0.11%), Albanian (8.6%, a difference of 0.12%), and Zimbabwean (8.6%, a difference of 0.13%).
| Demographics | Rating | Rank | Unemployment Among Women with Children Ages 6 to 17 years |
| Eastern Europeans | 96.8 /100 | #113 | Exceptional 8.6% |
| Immigrants | Russia | 96.7 /100 | #114 | Exceptional 8.6% |
| Argentineans | 96.5 /100 | #115 | Exceptional 8.6% |
| Zimbabweans | 96.3 /100 | #116 | Exceptional 8.6% |
| Albanians | 96.3 /100 | #117 | Exceptional 8.6% |
| Pueblo | 96.2 /100 | #118 | Exceptional 8.6% |
| Immigrants | Grenada | 96.2 /100 | #119 | Exceptional 8.6% |
| Israelis | 95.9 /100 | #120 | Exceptional 8.7% |
| Immigrants | Denmark | 95.5 /100 | #121 | Exceptional 8.7% |
| Immigrants | Egypt | 95.0 /100 | #122 | Exceptional 8.7% |
| Immigrants | Morocco | 94.9 /100 | #123 | Exceptional 8.7% |
| Immigrants | Lebanon | 94.9 /100 | #124 | Exceptional 8.7% |
| South Africans | 94.6 /100 | #125 | Exceptional 8.7% |
| Immigrants | Northern Africa | 94.4 /100 | #126 | Exceptional 8.7% |
| Czechs | 94.4 /100 | #127 | Exceptional 8.7% |
Demographics Similar to Chileans by Unemployment Among Women with Children Ages 6 to 17 years
In terms of unemployment among women with children ages 6 to 17 years, the demographic groups most similar to Chileans are Immigrants from Bangladesh (8.8%, a difference of 0.10%), Costa Rican (8.8%, a difference of 0.25%), Croatian (8.8%, a difference of 0.32%), Greek (8.9%, a difference of 0.37%), and Kenyan (8.8%, a difference of 0.40%).
| Demographics | Rating | Rank | Unemployment Among Women with Children Ages 6 to 17 years |
| Northern Europeans | 89.2 /100 | #139 | Excellent 8.8% |
| Immigrants | Poland | 88.3 /100 | #140 | Excellent 8.8% |
| Serbians | 87.6 /100 | #141 | Excellent 8.8% |
| Immigrants | Austria | 87.5 /100 | #142 | Excellent 8.8% |
| Immigrants | Kenya | 86.1 /100 | #143 | Excellent 8.8% |
| Russians | 85.8 /100 | #144 | Excellent 8.8% |
| Kenyans | 85.6 /100 | #145 | Excellent 8.8% |
| Chileans | 80.8 /100 | #146 | Excellent 8.8% |
| Immigrants | Bangladesh | 79.4 /100 | #147 | Good 8.8% |
| Costa Ricans | 77.0 /100 | #148 | Good 8.8% |
| Croatians | 76.0 /100 | #149 | Good 8.8% |
| Greeks | 75.2 /100 | #150 | Good 8.9% |
| Immigrants | Eastern Africa | 74.6 /100 | #151 | Good 8.9% |
| Immigrants | Northern Europe | 74.6 /100 | #152 | Good 8.9% |
| Immigrants | Europe | 73.4 /100 | #153 | Good 8.9% |