Israeli vs Icelander Female Unemployment
COMPARE
Israeli
Icelander
Female Unemployment
Female Unemployment Comparison
Israelis
Icelanders
5.5%
FEMALE UNEMPLOYMENT
4.8/ 100
METRIC RATING
228th/ 347
METRIC RANK
4.9%
FEMALE UNEMPLOYMENT
98.8/ 100
METRIC RATING
57th/ 347
METRIC RANK
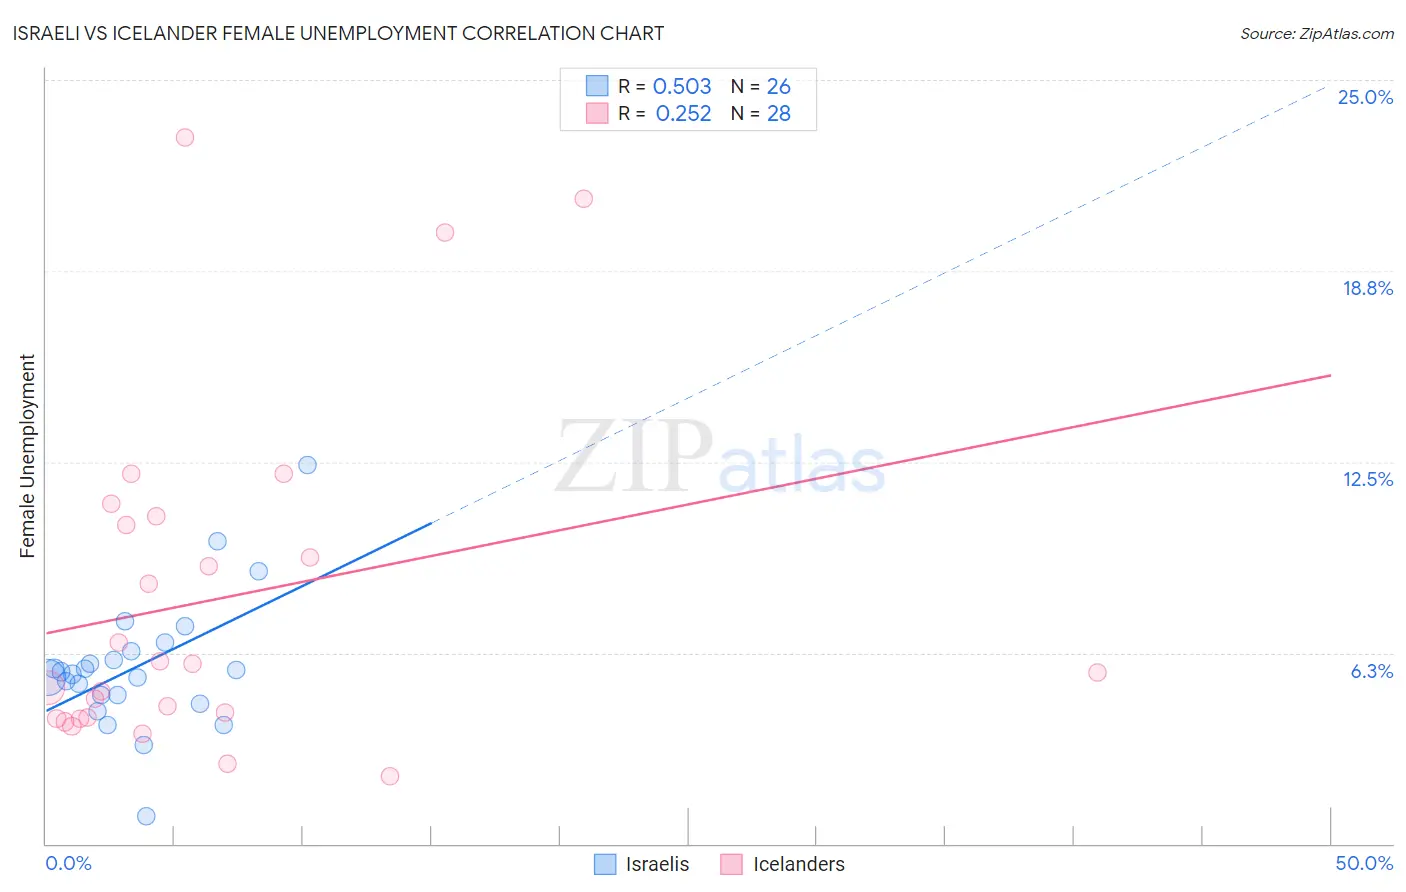
Israeli vs Icelander Female Unemployment Correlation Chart
The statistical analysis conducted on geographies consisting of 210,819,653 people shows a substantial positive correlation between the proportion of Israelis and unemploymnet rate among females in the United States with a correlation coefficient (R) of 0.503 and weighted average of 5.5%. Similarly, the statistical analysis conducted on geographies consisting of 159,215,997 people shows a weak positive correlation between the proportion of Icelanders and unemploymnet rate among females in the United States with a correlation coefficient (R) of 0.252 and weighted average of 4.9%, a difference of 11.9%.
Female Unemployment Correlation Summary
| Measurement | Israeli | Icelander |
| Minimum | 0.90% | 2.2% |
| Maximum | 12.4% | 23.1% |
| Range | 11.5% | 20.9% |
| Mean | 5.8% | 8.0% |
| Median | 5.6% | 5.8% |
| Interquartile 25% (IQ1) | 4.9% | 4.1% |
| Interquartile 75% (IQ3) | 6.3% | 10.6% |
| Interquartile Range (IQR) | 1.4% | 6.5% |
| Standard Deviation (Sample) | 2.2% | 5.6% |
| Standard Deviation (Population) | 2.1% | 5.5% |
Similar Demographics by Female Unemployment
Demographics Similar to Israelis by Female Unemployment
In terms of female unemployment, the demographic groups most similar to Israelis are Panamanian (5.5%, a difference of 0.010%), Immigrants from Uruguay (5.5%, a difference of 0.020%), Immigrants from Philippines (5.5%, a difference of 0.16%), Immigrants from Iraq (5.5%, a difference of 0.30%), and Liberian (5.5%, a difference of 0.30%).
| Demographics | Rating | Rank | Female Unemployment |
| Brazilians | 7.3 /100 | #221 | Tragic 5.5% |
| Nicaraguans | 7.2 /100 | #222 | Tragic 5.5% |
| Delaware | 7.2 /100 | #223 | Tragic 5.5% |
| Iraqis | 7.1 /100 | #224 | Tragic 5.5% |
| French American Indians | 6.1 /100 | #225 | Tragic 5.5% |
| Immigrants | Peru | 5.9 /100 | #226 | Tragic 5.5% |
| Immigrants | Philippines | 5.3 /100 | #227 | Tragic 5.5% |
| Israelis | 4.8 /100 | #228 | Tragic 5.5% |
| Panamanians | 4.7 /100 | #229 | Tragic 5.5% |
| Immigrants | Uruguay | 4.7 /100 | #230 | Tragic 5.5% |
| Immigrants | Iraq | 3.9 /100 | #231 | Tragic 5.5% |
| Liberians | 3.9 /100 | #232 | Tragic 5.5% |
| Moroccans | 3.4 /100 | #233 | Tragic 5.5% |
| Immigrants | Lebanon | 3.3 /100 | #234 | Tragic 5.5% |
| Immigrants | Iran | 3.3 /100 | #235 | Tragic 5.5% |
Demographics Similar to Icelanders by Female Unemployment
In terms of female unemployment, the demographic groups most similar to Icelanders are Immigrants from Lithuania (4.9%, a difference of 0.090%), Bhutanese (4.9%, a difference of 0.21%), Serbian (4.9%, a difference of 0.24%), Immigrants from Moldova (4.9%, a difference of 0.25%), and Immigrants from Zimbabwe (4.9%, a difference of 0.27%).
| Demographics | Rating | Rank | Female Unemployment |
| Immigrants | Cuba | 99.1 /100 | #50 | Exceptional 4.9% |
| Cambodians | 99.1 /100 | #51 | Exceptional 4.9% |
| Slavs | 99.1 /100 | #52 | Exceptional 4.9% |
| Whites/Caucasians | 99.0 /100 | #53 | Exceptional 4.9% |
| Immigrants | Zimbabwe | 99.0 /100 | #54 | Exceptional 4.9% |
| Immigrants | Moldova | 99.0 /100 | #55 | Exceptional 4.9% |
| Serbians | 99.0 /100 | #56 | Exceptional 4.9% |
| Icelanders | 98.8 /100 | #57 | Exceptional 4.9% |
| Immigrants | Lithuania | 98.8 /100 | #58 | Exceptional 4.9% |
| Bhutanese | 98.7 /100 | #59 | Exceptional 4.9% |
| Immigrants | Scotland | 98.6 /100 | #60 | Exceptional 4.9% |
| Immigrants | Canada | 98.6 /100 | #61 | Exceptional 4.9% |
| Immigrants | Nepal | 98.6 /100 | #62 | Exceptional 4.9% |
| Immigrants | Belgium | 98.5 /100 | #63 | Exceptional 4.9% |
| Celtics | 98.5 /100 | #64 | Exceptional 4.9% |