Israeli vs Immigrants from Spain Female Unemployment
COMPARE
Israeli
Immigrants from Spain
Female Unemployment
Female Unemployment Comparison
Israelis
Immigrants from Spain
5.5%
FEMALE UNEMPLOYMENT
4.8/ 100
METRIC RATING
228th/ 347
METRIC RANK
5.2%
FEMALE UNEMPLOYMENT
66.8/ 100
METRIC RATING
160th/ 347
METRIC RANK
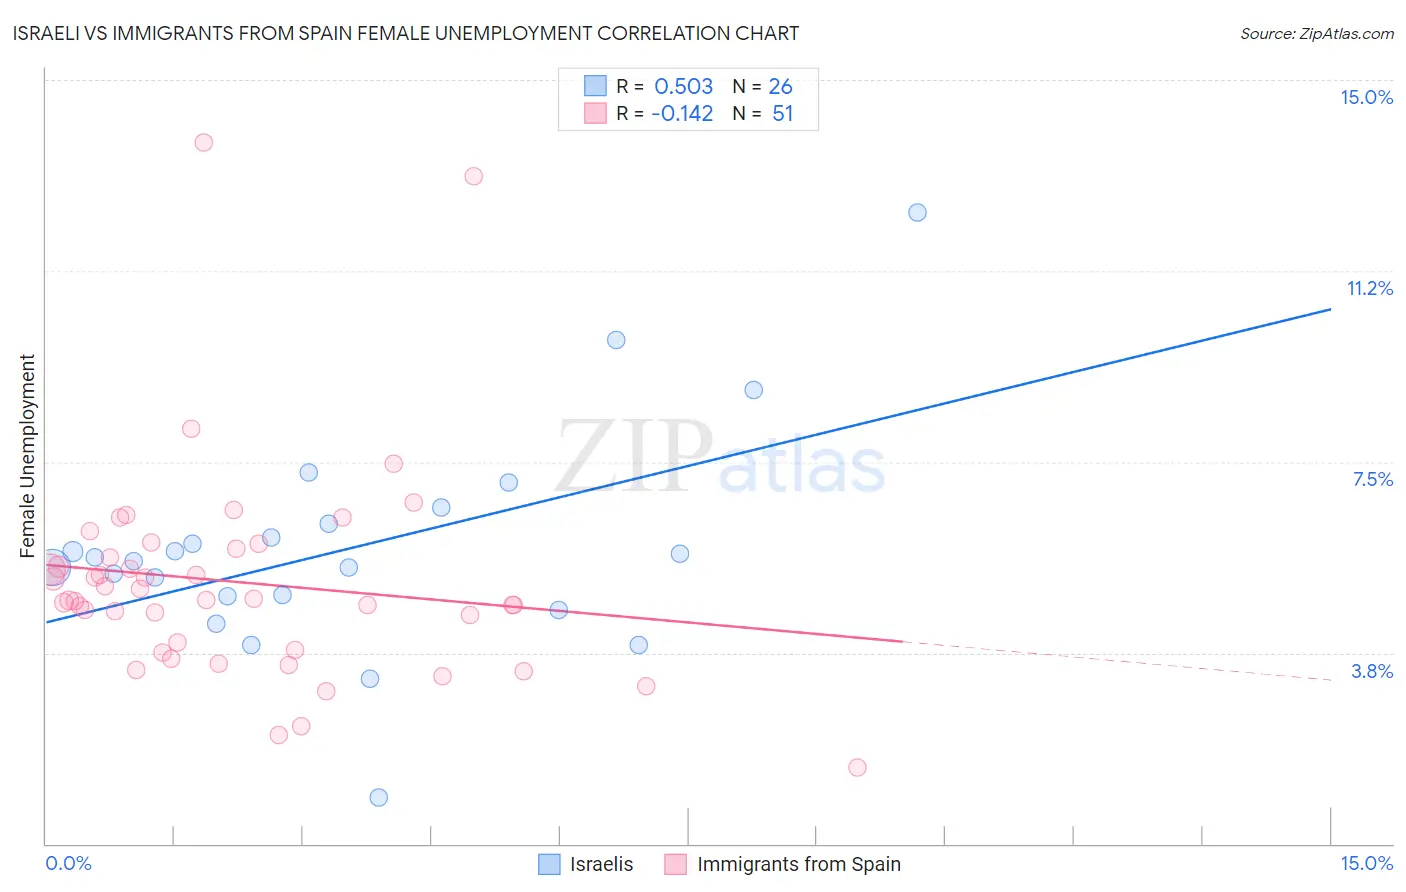
Israeli vs Immigrants from Spain Female Unemployment Correlation Chart
The statistical analysis conducted on geographies consisting of 210,819,653 people shows a substantial positive correlation between the proportion of Israelis and unemploymnet rate among females in the United States with a correlation coefficient (R) of 0.503 and weighted average of 5.5%. Similarly, the statistical analysis conducted on geographies consisting of 239,203,477 people shows a poor negative correlation between the proportion of Immigrants from Spain and unemploymnet rate among females in the United States with a correlation coefficient (R) of -0.142 and weighted average of 5.2%, a difference of 5.6%.
Female Unemployment Correlation Summary
| Measurement | Israeli | Immigrants from Spain |
| Minimum | 0.90% | 1.5% |
| Maximum | 12.4% | 13.8% |
| Range | 11.5% | 12.3% |
| Mean | 5.8% | 5.1% |
| Median | 5.6% | 4.8% |
| Interquartile 25% (IQ1) | 4.9% | 3.8% |
| Interquartile 75% (IQ3) | 6.3% | 5.8% |
| Interquartile Range (IQR) | 1.4% | 2.0% |
| Standard Deviation (Sample) | 2.2% | 2.1% |
| Standard Deviation (Population) | 2.1% | 2.1% |
Similar Demographics by Female Unemployment
Demographics Similar to Israelis by Female Unemployment
In terms of female unemployment, the demographic groups most similar to Israelis are Panamanian (5.5%, a difference of 0.010%), Immigrants from Uruguay (5.5%, a difference of 0.020%), Immigrants from Philippines (5.5%, a difference of 0.16%), Immigrants from Iraq (5.5%, a difference of 0.30%), and Liberian (5.5%, a difference of 0.30%).
| Demographics | Rating | Rank | Female Unemployment |
| Brazilians | 7.3 /100 | #221 | Tragic 5.5% |
| Nicaraguans | 7.2 /100 | #222 | Tragic 5.5% |
| Delaware | 7.2 /100 | #223 | Tragic 5.5% |
| Iraqis | 7.1 /100 | #224 | Tragic 5.5% |
| French American Indians | 6.1 /100 | #225 | Tragic 5.5% |
| Immigrants | Peru | 5.9 /100 | #226 | Tragic 5.5% |
| Immigrants | Philippines | 5.3 /100 | #227 | Tragic 5.5% |
| Israelis | 4.8 /100 | #228 | Tragic 5.5% |
| Panamanians | 4.7 /100 | #229 | Tragic 5.5% |
| Immigrants | Uruguay | 4.7 /100 | #230 | Tragic 5.5% |
| Immigrants | Iraq | 3.9 /100 | #231 | Tragic 5.5% |
| Liberians | 3.9 /100 | #232 | Tragic 5.5% |
| Moroccans | 3.4 /100 | #233 | Tragic 5.5% |
| Immigrants | Lebanon | 3.3 /100 | #234 | Tragic 5.5% |
| Immigrants | Iran | 3.3 /100 | #235 | Tragic 5.5% |
Demographics Similar to Immigrants from Spain by Female Unemployment
In terms of female unemployment, the demographic groups most similar to Immigrants from Spain are Immigrants from Pakistan (5.2%, a difference of 0.0%), Immigrants from Micronesia (5.2%, a difference of 0.010%), Potawatomi (5.2%, a difference of 0.060%), Albanian (5.2%, a difference of 0.11%), and Immigrants from Asia (5.2%, a difference of 0.17%).
| Demographics | Rating | Rank | Female Unemployment |
| Immigrants | Greece | 74.9 /100 | #153 | Good 5.2% |
| South Africans | 70.8 /100 | #154 | Good 5.2% |
| Immigrants | Egypt | 70.0 /100 | #155 | Good 5.2% |
| Immigrants | Northern Africa | 69.6 /100 | #156 | Good 5.2% |
| Immigrants | Russia | 69.3 /100 | #157 | Good 5.2% |
| Albanians | 68.3 /100 | #158 | Good 5.2% |
| Immigrants | Micronesia | 66.9 /100 | #159 | Good 5.2% |
| Immigrants | Spain | 66.8 /100 | #160 | Good 5.2% |
| Immigrants | Pakistan | 66.7 /100 | #161 | Good 5.2% |
| Potawatomi | 65.9 /100 | #162 | Good 5.2% |
| Immigrants | Asia | 64.3 /100 | #163 | Good 5.2% |
| Bangladeshis | 64.3 /100 | #164 | Good 5.2% |
| Syrians | 62.8 /100 | #165 | Good 5.2% |
| Native Hawaiians | 62.7 /100 | #166 | Good 5.2% |
| Immigrants | Thailand | 62.1 /100 | #167 | Good 5.2% |