Immigrants from Ghana vs Paiute Female Unemployment
COMPARE
Immigrants from Ghana
Paiute
Female Unemployment
Female Unemployment Comparison
Immigrants from Ghana
Paiute
6.0%
FEMALE UNEMPLOYMENT
0.0/ 100
METRIC RATING
277th/ 347
METRIC RANK
6.8%
FEMALE UNEMPLOYMENT
0.0/ 100
METRIC RATING
331st/ 347
METRIC RANK
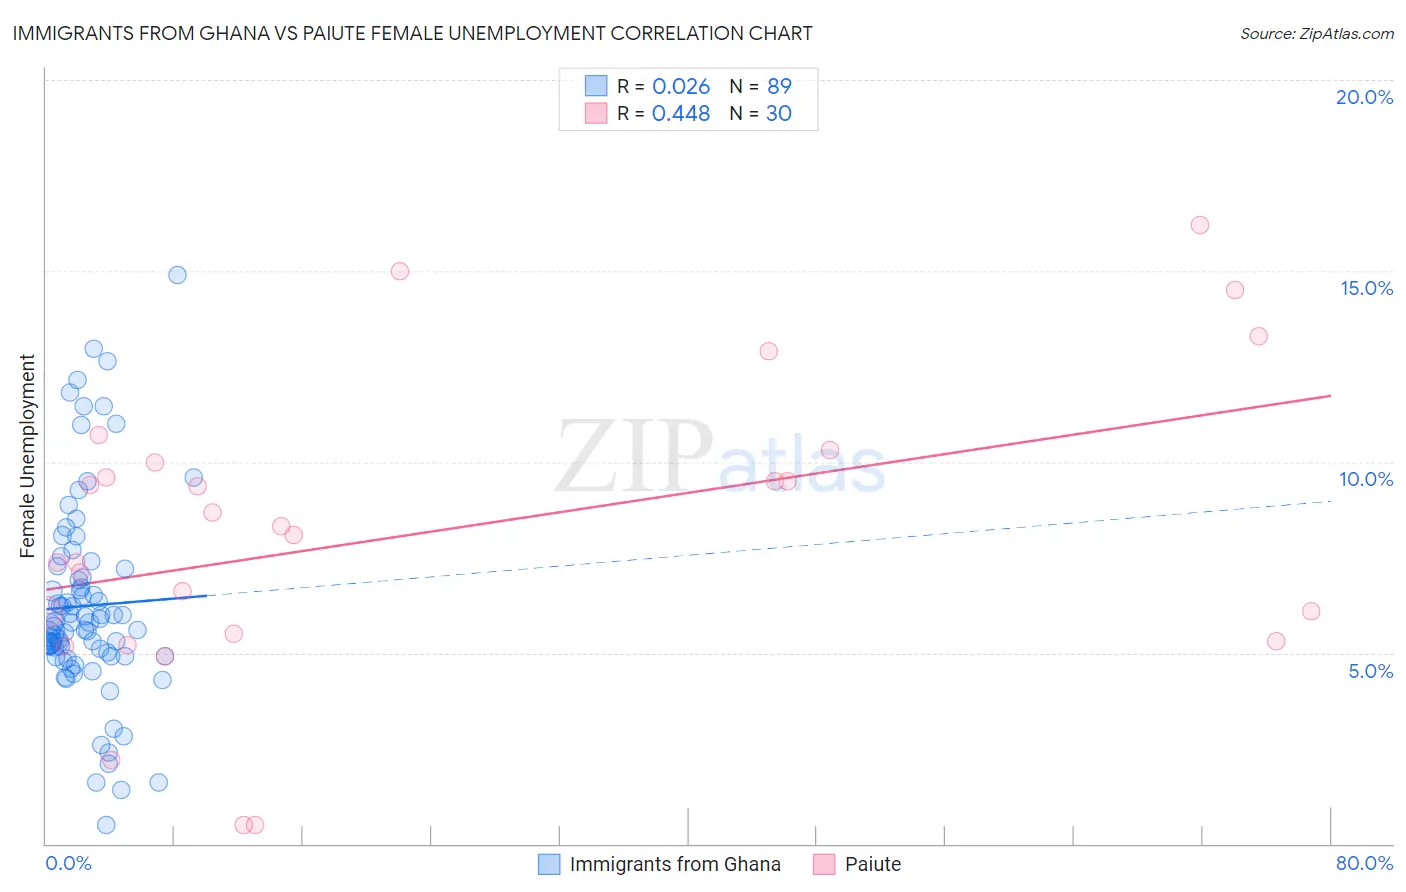
Immigrants from Ghana vs Paiute Female Unemployment Correlation Chart
The statistical analysis conducted on geographies consisting of 199,631,349 people shows no correlation between the proportion of Immigrants from Ghana and unemploymnet rate among females in the United States with a correlation coefficient (R) of 0.026 and weighted average of 6.0%. Similarly, the statistical analysis conducted on geographies consisting of 58,292,378 people shows a moderate positive correlation between the proportion of Paiute and unemploymnet rate among females in the United States with a correlation coefficient (R) of 0.448 and weighted average of 6.8%, a difference of 13.2%.
Female Unemployment Correlation Summary
| Measurement | Immigrants from Ghana | Paiute |
| Minimum | 0.50% | 0.50% |
| Maximum | 14.9% | 16.2% |
| Range | 14.4% | 15.7% |
| Mean | 6.2% | 8.2% |
| Median | 5.7% | 8.2% |
| Interquartile 25% (IQ1) | 4.9% | 5.5% |
| Interquartile 75% (IQ3) | 7.1% | 10.0% |
| Interquartile Range (IQR) | 2.2% | 4.5% |
| Standard Deviation (Sample) | 2.6% | 3.9% |
| Standard Deviation (Population) | 2.6% | 3.8% |
Similar Demographics by Female Unemployment
Demographics Similar to Immigrants from Ghana by Female Unemployment
In terms of female unemployment, the demographic groups most similar to Immigrants from Ghana are Yaqui (6.0%, a difference of 0.0%), Armenian (6.0%, a difference of 0.12%), Mexican American Indian (6.0%, a difference of 0.17%), Guatemalan (6.0%, a difference of 0.21%), and Bahamian (6.0%, a difference of 0.40%).
| Demographics | Rating | Rank | Female Unemployment |
| Immigrants | Honduras | 0.0 /100 | #270 | Tragic 5.9% |
| Central Americans | 0.0 /100 | #271 | Tragic 5.9% |
| Lumbee | 0.0 /100 | #272 | Tragic 5.9% |
| Ghanaians | 0.0 /100 | #273 | Tragic 5.9% |
| Africans | 0.0 /100 | #274 | Tragic 5.9% |
| Senegalese | 0.0 /100 | #275 | Tragic 6.0% |
| Bahamians | 0.0 /100 | #276 | Tragic 6.0% |
| Immigrants | Ghana | 0.0 /100 | #277 | Tragic 6.0% |
| Yaqui | 0.0 /100 | #278 | Tragic 6.0% |
| Armenians | 0.0 /100 | #279 | Tragic 6.0% |
| Mexican American Indians | 0.0 /100 | #280 | Tragic 6.0% |
| Guatemalans | 0.0 /100 | #281 | Tragic 6.0% |
| Colville | 0.0 /100 | #282 | Tragic 6.0% |
| Salvadorans | 0.0 /100 | #283 | Tragic 6.0% |
| Immigrants | Senegal | 0.0 /100 | #284 | Tragic 6.1% |
Demographics Similar to Paiute by Female Unemployment
In terms of female unemployment, the demographic groups most similar to Paiute are Yakama (6.7%, a difference of 1.1%), Immigrants from Guyana (6.7%, a difference of 1.7%), Guyanese (6.7%, a difference of 2.1%), Alaska Native (6.6%, a difference of 2.5%), and Native/Alaskan (6.6%, a difference of 2.6%).
| Demographics | Rating | Rank | Female Unemployment |
| Cheyenne | 0.0 /100 | #324 | Tragic 6.6% |
| Apache | 0.0 /100 | #325 | Tragic 6.6% |
| Natives/Alaskans | 0.0 /100 | #326 | Tragic 6.6% |
| Alaska Natives | 0.0 /100 | #327 | Tragic 6.6% |
| Guyanese | 0.0 /100 | #328 | Tragic 6.7% |
| Immigrants | Guyana | 0.0 /100 | #329 | Tragic 6.7% |
| Yakama | 0.0 /100 | #330 | Tragic 6.7% |
| Paiute | 0.0 /100 | #331 | Tragic 6.8% |
| Sioux | 0.0 /100 | #332 | Tragic 7.0% |
| Menominee | 0.0 /100 | #333 | Tragic 7.0% |
| Immigrants | Armenia | 0.0 /100 | #334 | Tragic 7.1% |
| Dominicans | 0.0 /100 | #335 | Tragic 7.2% |
| Immigrants | Dominican Republic | 0.0 /100 | #336 | Tragic 7.2% |
| Navajo | 0.0 /100 | #337 | Tragic 7.3% |
| Tohono O'odham | 0.0 /100 | #338 | Tragic 7.7% |