Immigrants vs Guatemalan 3rd Grade
COMPARE
Immigrants
Guatemalan
3rd Grade
3rd Grade Comparison
Immigrants
Guatemalans
96.9%
3RD GRADE
0.0/ 100
METRIC RATING
296th/ 347
METRIC RANK
96.0%
3RD GRADE
0.0/ 100
METRIC RATING
338th/ 347
METRIC RANK
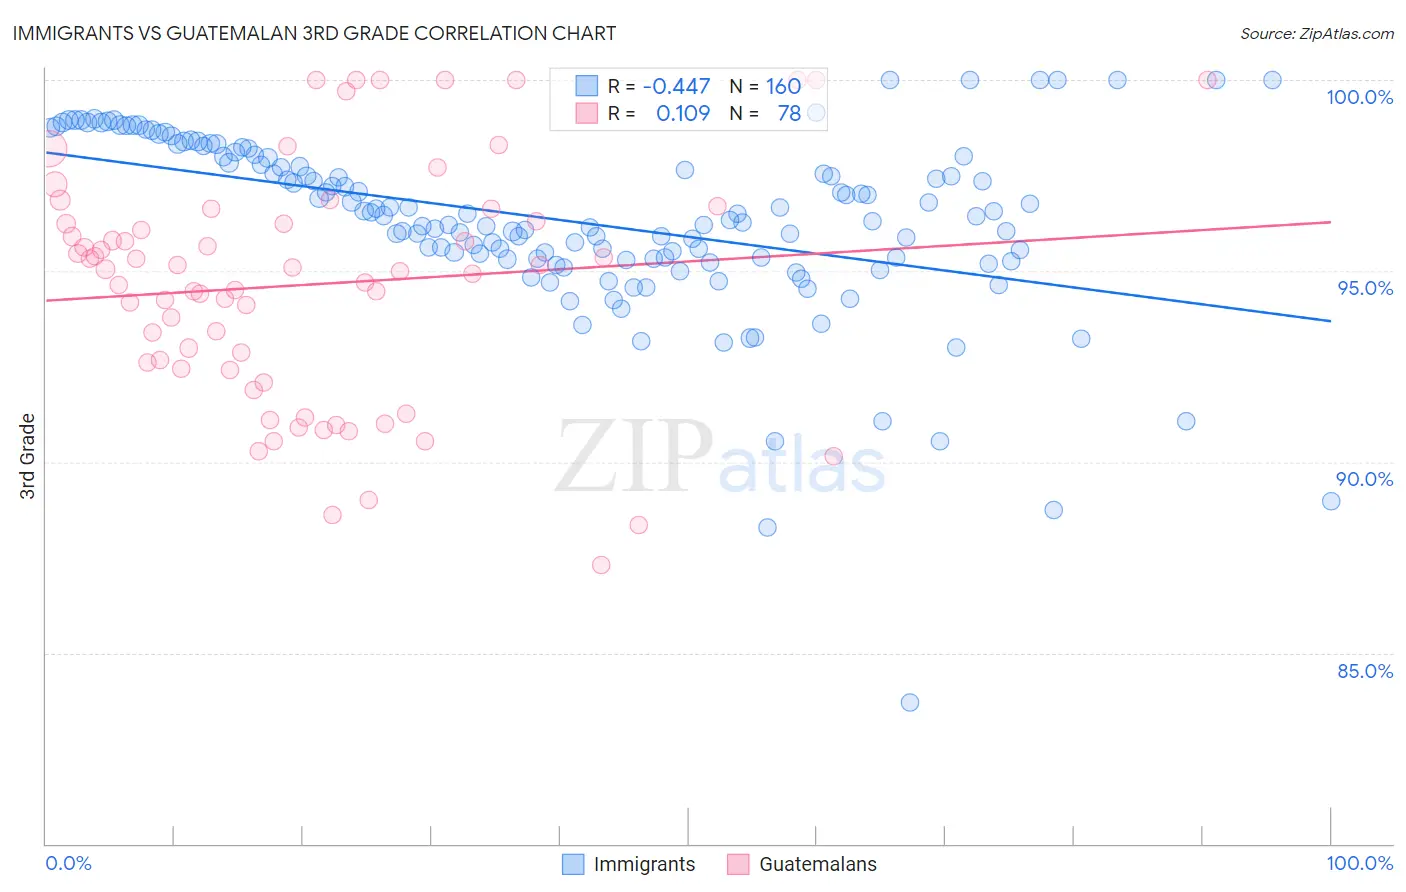
Immigrants vs Guatemalan 3rd Grade Correlation Chart
The statistical analysis conducted on geographies consisting of 577,788,049 people shows a moderate negative correlation between the proportion of Immigrants and percentage of population with at least 3rd grade education in the United States with a correlation coefficient (R) of -0.447 and weighted average of 96.9%. Similarly, the statistical analysis conducted on geographies consisting of 409,566,469 people shows a poor positive correlation between the proportion of Guatemalans and percentage of population with at least 3rd grade education in the United States with a correlation coefficient (R) of 0.109 and weighted average of 96.0%, a difference of 0.94%.
3rd Grade Correlation Summary
| Measurement | Immigrants | Guatemalan |
| Minimum | 83.7% | 87.3% |
| Maximum | 100.0% | 100.0% |
| Range | 16.3% | 12.7% |
| Mean | 96.3% | 94.6% |
| Median | 96.4% | 95.0% |
| Interquartile 25% (IQ1) | 95.3% | 92.4% |
| Interquartile 75% (IQ3) | 98.0% | 96.3% |
| Interquartile Range (IQR) | 2.7% | 3.9% |
| Standard Deviation (Sample) | 2.4% | 3.1% |
| Standard Deviation (Population) | 2.4% | 3.1% |
Similar Demographics by 3rd Grade
Demographics Similar to Immigrants by 3rd Grade
In terms of 3rd grade, the demographic groups most similar to Immigrants are Haitian (96.9%, a difference of 0.020%), Immigrants from Dominica (96.9%, a difference of 0.030%), Somali (96.8%, a difference of 0.040%), Immigrants from South Eastern Asia (96.8%, a difference of 0.050%), and Immigrants from Cuba (96.8%, a difference of 0.050%).
| Demographics | Rating | Rank | 3rd Grade |
| Immigrants | Thailand | 0.0 /100 | #289 | Tragic 97.1% |
| Immigrants | Portugal | 0.0 /100 | #290 | Tragic 97.0% |
| Immigrants | Afghanistan | 0.0 /100 | #291 | Tragic 97.0% |
| British West Indians | 0.0 /100 | #292 | Tragic 97.0% |
| Immigrants | Grenada | 0.0 /100 | #293 | Tragic 97.0% |
| Malaysians | 0.0 /100 | #294 | Tragic 97.0% |
| Immigrants | Eritrea | 0.0 /100 | #295 | Tragic 97.0% |
| Immigrants | Immigrants | 0.0 /100 | #296 | Tragic 96.9% |
| Haitians | 0.0 /100 | #297 | Tragic 96.9% |
| Immigrants | Dominica | 0.0 /100 | #298 | Tragic 96.9% |
| Somalis | 0.0 /100 | #299 | Tragic 96.8% |
| Immigrants | South Eastern Asia | 0.0 /100 | #300 | Tragic 96.8% |
| Immigrants | Cuba | 0.0 /100 | #301 | Tragic 96.8% |
| Immigrants | Somalia | 0.0 /100 | #302 | Tragic 96.8% |
| Ecuadorians | 0.0 /100 | #303 | Tragic 96.7% |
Demographics Similar to Guatemalans by 3rd Grade
In terms of 3rd grade, the demographic groups most similar to Guatemalans are Yakama (95.9%, a difference of 0.030%), Nepalese (95.9%, a difference of 0.11%), Central American (96.1%, a difference of 0.12%), Immigrants from Central America (95.8%, a difference of 0.17%), and Immigrants from Guatemala (95.8%, a difference of 0.17%).
| Demographics | Rating | Rank | 3rd Grade |
| Immigrants | Latin America | 0.0 /100 | #331 | Tragic 96.2% |
| Mexicans | 0.0 /100 | #332 | Tragic 96.2% |
| Immigrants | Fiji | 0.0 /100 | #333 | Tragic 96.2% |
| Immigrants | Cambodia | 0.0 /100 | #334 | Tragic 96.2% |
| Immigrants | Dominican Republic | 0.0 /100 | #335 | Tragic 96.2% |
| Immigrants | Cabo Verde | 0.0 /100 | #336 | Tragic 96.2% |
| Central Americans | 0.0 /100 | #337 | Tragic 96.1% |
| Guatemalans | 0.0 /100 | #338 | Tragic 96.0% |
| Yakama | 0.0 /100 | #339 | Tragic 95.9% |
| Nepalese | 0.0 /100 | #340 | Tragic 95.9% |
| Immigrants | Central America | 0.0 /100 | #341 | Tragic 95.8% |
| Immigrants | Guatemala | 0.0 /100 | #342 | Tragic 95.8% |
| Immigrants | Mexico | 0.0 /100 | #343 | Tragic 95.8% |
| Salvadorans | 0.0 /100 | #344 | Tragic 95.7% |
| Immigrants | Yemen | 0.0 /100 | #345 | Tragic 95.6% |