Immigrants from Zimbabwe vs Spanish American Unemployment Among Women with Children Under 6 years
COMPARE
Immigrants from Zimbabwe
Spanish American
Unemployment Among Women with Children Under 6 years
Unemployment Among Women with Children Under 6 years Comparison
Immigrants from Zimbabwe
Spanish Americans
7.1%
UNEMPLOYMENT AMONG WOMEN WITH CHILDREN UNDER 6 YEARS
98.6/ 100
METRIC RATING
86th/ 347
METRIC RANK
7.7%
UNEMPLOYMENT AMONG WOMEN WITH CHILDREN UNDER 6 YEARS
39.7/ 100
METRIC RATING
185th/ 347
METRIC RANK
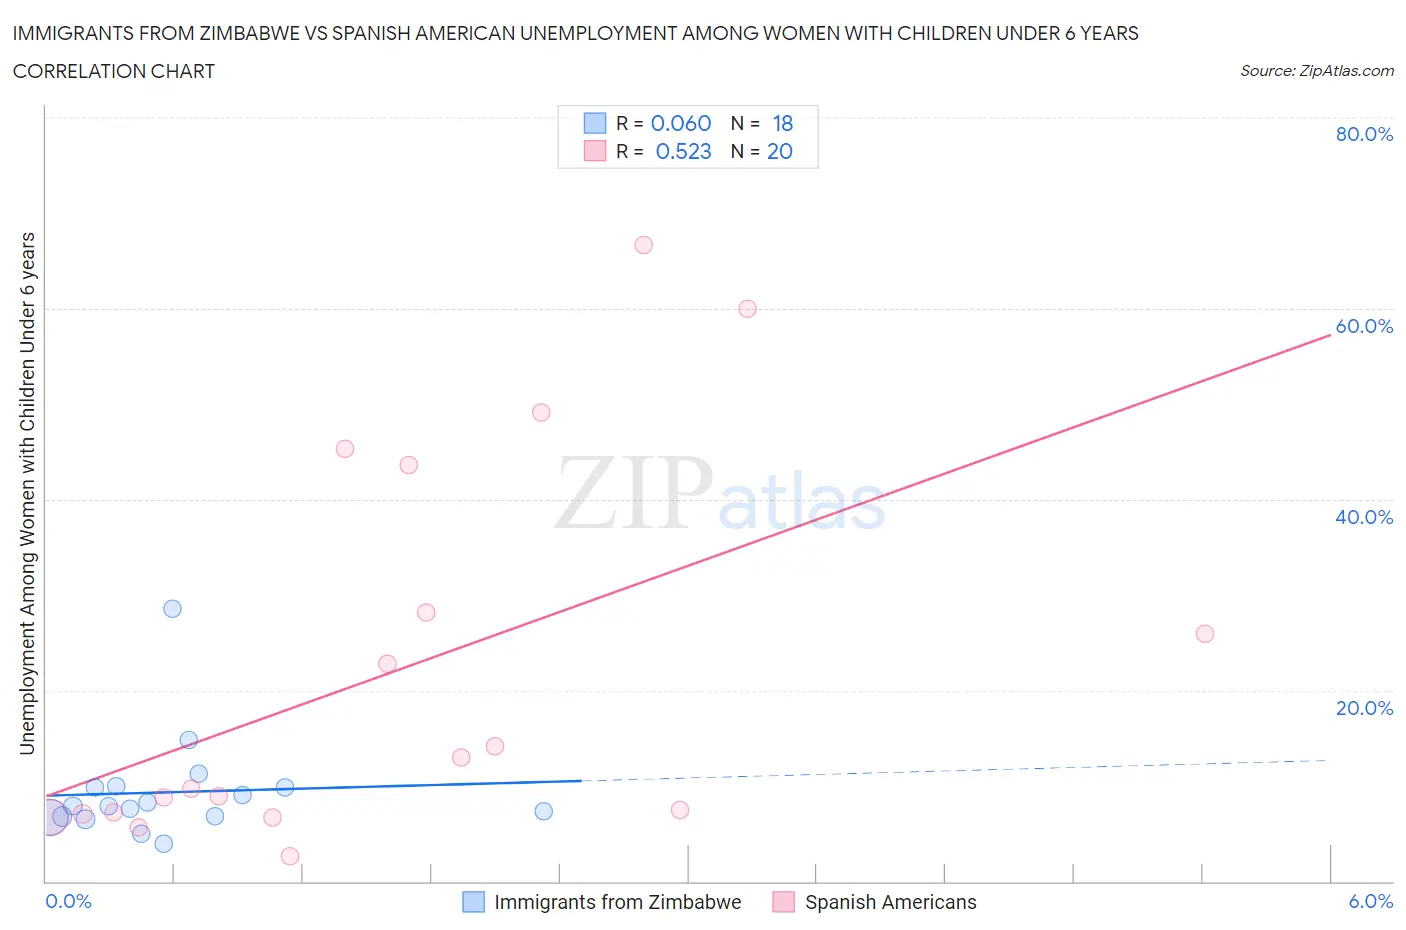
Immigrants from Zimbabwe vs Spanish American Unemployment Among Women with Children Under 6 years Correlation Chart
The statistical analysis conducted on geographies consisting of 104,806,788 people shows a slight positive correlation between the proportion of Immigrants from Zimbabwe and unemployment rate among women with children under the age of 6 in the United States with a correlation coefficient (R) of 0.060 and weighted average of 7.1%. Similarly, the statistical analysis conducted on geographies consisting of 94,405,030 people shows a substantial positive correlation between the proportion of Spanish Americans and unemployment rate among women with children under the age of 6 in the United States with a correlation coefficient (R) of 0.523 and weighted average of 7.7%, a difference of 8.3%.
Unemployment Among Women with Children Under 6 years Correlation Summary
| Measurement | Immigrants from Zimbabwe | Spanish American |
| Minimum | 3.9% | 2.6% |
| Maximum | 28.6% | 66.7% |
| Range | 24.7% | 64.1% |
| Mean | 9.3% | 22.0% |
| Median | 7.9% | 11.3% |
| Interquartile 25% (IQ1) | 6.8% | 7.1% |
| Interquartile 75% (IQ3) | 9.9% | 35.9% |
| Interquartile Range (IQR) | 3.1% | 28.7% |
| Standard Deviation (Sample) | 5.4% | 20.1% |
| Standard Deviation (Population) | 5.2% | 19.6% |
Similar Demographics by Unemployment Among Women with Children Under 6 years
Demographics Similar to Immigrants from Zimbabwe by Unemployment Among Women with Children Under 6 years
In terms of unemployment among women with children under 6 years, the demographic groups most similar to Immigrants from Zimbabwe are Immigrants from Romania (7.1%, a difference of 0.13%), Alsatian (7.1%, a difference of 0.15%), Immigrants from Albania (7.1%, a difference of 0.16%), Egyptian (7.1%, a difference of 0.21%), and Immigrants from Afghanistan (7.1%, a difference of 0.25%).
| Demographics | Rating | Rank | Unemployment Among Women with Children Under 6 years |
| Immigrants | Fiji | 98.9 /100 | #79 | Exceptional 7.1% |
| Immigrants | Greece | 98.9 /100 | #80 | Exceptional 7.1% |
| Immigrants | Venezuela | 98.8 /100 | #81 | Exceptional 7.1% |
| Immigrants | Afghanistan | 98.7 /100 | #82 | Exceptional 7.1% |
| Egyptians | 98.7 /100 | #83 | Exceptional 7.1% |
| Immigrants | Albania | 98.7 /100 | #84 | Exceptional 7.1% |
| Immigrants | Romania | 98.7 /100 | #85 | Exceptional 7.1% |
| Immigrants | Zimbabwe | 98.6 /100 | #86 | Exceptional 7.1% |
| Alsatians | 98.4 /100 | #87 | Exceptional 7.1% |
| Immigrants | Hungary | 98.3 /100 | #88 | Exceptional 7.1% |
| Immigrants | Denmark | 98.3 /100 | #89 | Exceptional 7.1% |
| Immigrants | Spain | 98.2 /100 | #90 | Exceptional 7.1% |
| Danes | 98.2 /100 | #91 | Exceptional 7.1% |
| Albanians | 98.0 /100 | #92 | Exceptional 7.2% |
| New Zealanders | 97.8 /100 | #93 | Exceptional 7.2% |
Demographics Similar to Spanish Americans by Unemployment Among Women with Children Under 6 years
In terms of unemployment among women with children under 6 years, the demographic groups most similar to Spanish Americans are Yugoslavian (7.7%, a difference of 0.020%), Indonesian (7.7%, a difference of 0.060%), Immigrants from Thailand (7.7%, a difference of 0.080%), Czechoslovakian (7.7%, a difference of 0.080%), and Sierra Leonean (7.7%, a difference of 0.22%).
| Demographics | Rating | Rank | Unemployment Among Women with Children Under 6 years |
| Immigrants | England | 45.4 /100 | #178 | Average 7.7% |
| Immigrants | Western Europe | 44.9 /100 | #179 | Average 7.7% |
| Immigrants | Uruguay | 44.5 /100 | #180 | Average 7.7% |
| Brazilians | 43.9 /100 | #181 | Average 7.7% |
| Nepalese | 43.5 /100 | #182 | Average 7.7% |
| Sierra Leoneans | 42.9 /100 | #183 | Average 7.7% |
| Indonesians | 40.5 /100 | #184 | Average 7.7% |
| Spanish Americans | 39.7 /100 | #185 | Fair 7.7% |
| Yugoslavians | 39.4 /100 | #186 | Fair 7.7% |
| Immigrants | Thailand | 38.5 /100 | #187 | Fair 7.7% |
| Czechoslovakians | 38.4 /100 | #188 | Fair 7.7% |
| Immigrants | Panama | 35.7 /100 | #189 | Fair 7.7% |
| Immigrants | North Macedonia | 34.4 /100 | #190 | Fair 7.7% |
| Immigrants | Austria | 32.4 /100 | #191 | Fair 7.7% |
| Immigrants | Africa | 32.4 /100 | #192 | Fair 7.7% |