Immigrants from Zimbabwe vs Armenian Unemployment Among Women with Children Under 6 years
COMPARE
Immigrants from Zimbabwe
Armenian
Unemployment Among Women with Children Under 6 years
Unemployment Among Women with Children Under 6 years Comparison
Immigrants from Zimbabwe
Armenians
7.1%
UNEMPLOYMENT AMONG WOMEN WITH CHILDREN UNDER 6 YEARS
98.6/ 100
METRIC RATING
86th/ 347
METRIC RANK
7.2%
UNEMPLOYMENT AMONG WOMEN WITH CHILDREN UNDER 6 YEARS
95.9/ 100
METRIC RATING
116th/ 347
METRIC RANK
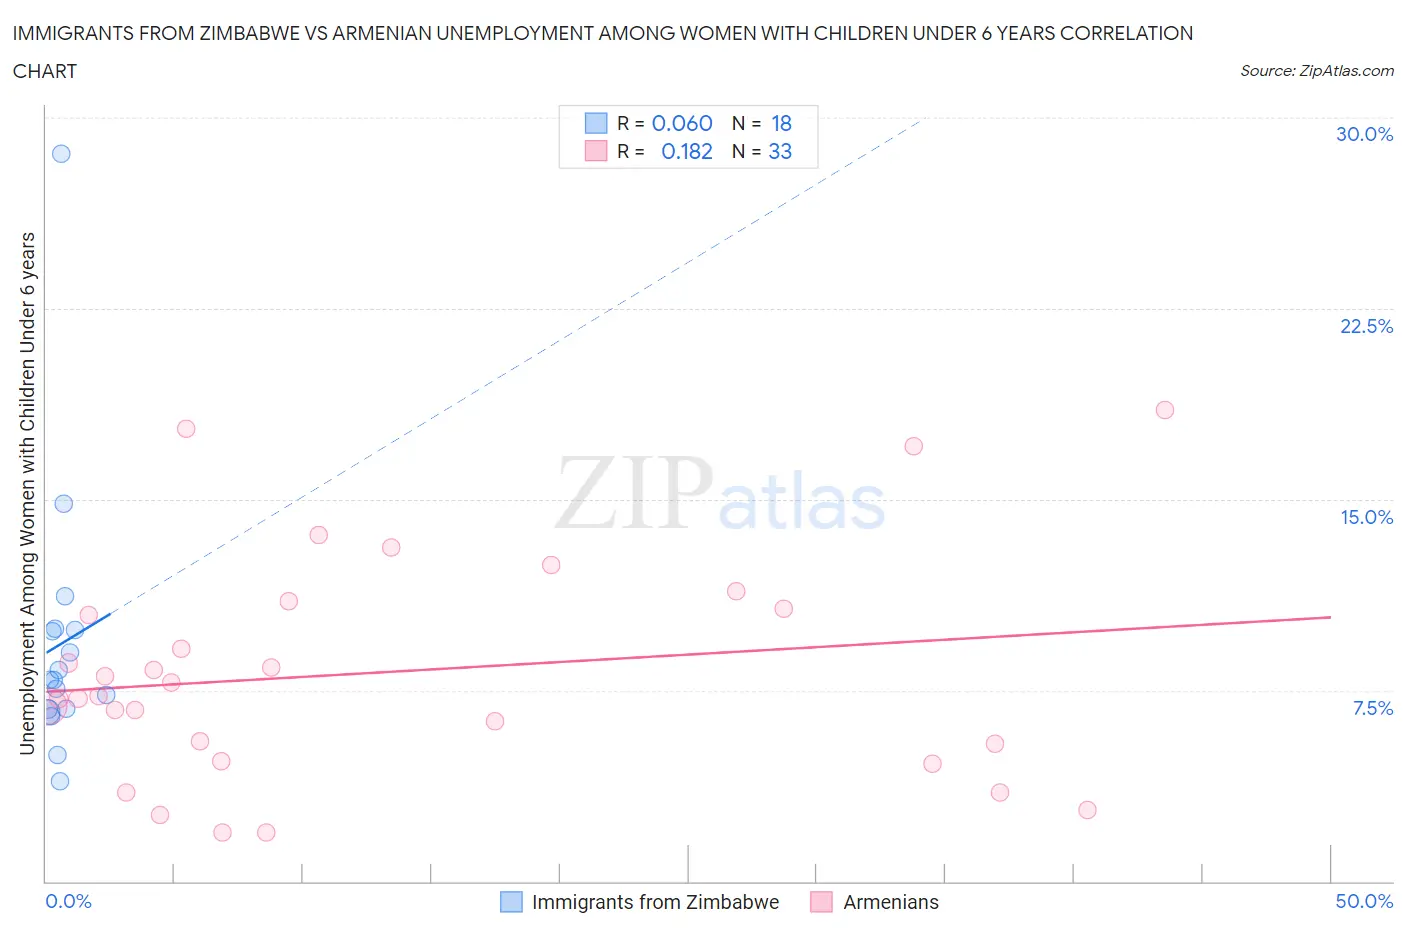
Immigrants from Zimbabwe vs Armenian Unemployment Among Women with Children Under 6 years Correlation Chart
The statistical analysis conducted on geographies consisting of 104,806,788 people shows a slight positive correlation between the proportion of Immigrants from Zimbabwe and unemployment rate among women with children under the age of 6 in the United States with a correlation coefficient (R) of 0.060 and weighted average of 7.1%. Similarly, the statistical analysis conducted on geographies consisting of 243,507,724 people shows a poor positive correlation between the proportion of Armenians and unemployment rate among women with children under the age of 6 in the United States with a correlation coefficient (R) of 0.182 and weighted average of 7.2%, a difference of 1.9%.
Unemployment Among Women with Children Under 6 years Correlation Summary
| Measurement | Immigrants from Zimbabwe | Armenian |
| Minimum | 3.9% | 1.9% |
| Maximum | 28.6% | 18.5% |
| Range | 24.7% | 16.6% |
| Mean | 9.3% | 8.2% |
| Median | 7.9% | 7.3% |
| Interquartile 25% (IQ1) | 6.8% | 5.0% |
| Interquartile 75% (IQ3) | 9.9% | 10.8% |
| Interquartile Range (IQR) | 3.1% | 5.8% |
| Standard Deviation (Sample) | 5.4% | 4.4% |
| Standard Deviation (Population) | 5.2% | 4.3% |
Similar Demographics by Unemployment Among Women with Children Under 6 years
Demographics Similar to Immigrants from Zimbabwe by Unemployment Among Women with Children Under 6 years
In terms of unemployment among women with children under 6 years, the demographic groups most similar to Immigrants from Zimbabwe are Immigrants from Romania (7.1%, a difference of 0.13%), Alsatian (7.1%, a difference of 0.15%), Immigrants from Albania (7.1%, a difference of 0.16%), Egyptian (7.1%, a difference of 0.21%), and Immigrants from Afghanistan (7.1%, a difference of 0.25%).
| Demographics | Rating | Rank | Unemployment Among Women with Children Under 6 years |
| Immigrants | Fiji | 98.9 /100 | #79 | Exceptional 7.1% |
| Immigrants | Greece | 98.9 /100 | #80 | Exceptional 7.1% |
| Immigrants | Venezuela | 98.8 /100 | #81 | Exceptional 7.1% |
| Immigrants | Afghanistan | 98.7 /100 | #82 | Exceptional 7.1% |
| Egyptians | 98.7 /100 | #83 | Exceptional 7.1% |
| Immigrants | Albania | 98.7 /100 | #84 | Exceptional 7.1% |
| Immigrants | Romania | 98.7 /100 | #85 | Exceptional 7.1% |
| Immigrants | Zimbabwe | 98.6 /100 | #86 | Exceptional 7.1% |
| Alsatians | 98.4 /100 | #87 | Exceptional 7.1% |
| Immigrants | Hungary | 98.3 /100 | #88 | Exceptional 7.1% |
| Immigrants | Denmark | 98.3 /100 | #89 | Exceptional 7.1% |
| Immigrants | Spain | 98.2 /100 | #90 | Exceptional 7.1% |
| Danes | 98.2 /100 | #91 | Exceptional 7.1% |
| Albanians | 98.0 /100 | #92 | Exceptional 7.2% |
| New Zealanders | 97.8 /100 | #93 | Exceptional 7.2% |
Demographics Similar to Armenians by Unemployment Among Women with Children Under 6 years
In terms of unemployment among women with children under 6 years, the demographic groups most similar to Armenians are Immigrants from Italy (7.2%, a difference of 0.10%), Argentinean (7.2%, a difference of 0.17%), Immigrants from Kenya (7.3%, a difference of 0.21%), Nicaraguan (7.2%, a difference of 0.22%), and Israeli (7.2%, a difference of 0.30%).
| Demographics | Rating | Rank | Unemployment Among Women with Children Under 6 years |
| Australians | 96.9 /100 | #109 | Exceptional 7.2% |
| Palestinians | 96.8 /100 | #110 | Exceptional 7.2% |
| Norwegians | 96.7 /100 | #111 | Exceptional 7.2% |
| Israelis | 96.5 /100 | #112 | Exceptional 7.2% |
| Nicaraguans | 96.3 /100 | #113 | Exceptional 7.2% |
| Argentineans | 96.2 /100 | #114 | Exceptional 7.2% |
| Immigrants | Italy | 96.1 /100 | #115 | Exceptional 7.2% |
| Armenians | 95.9 /100 | #116 | Exceptional 7.2% |
| Immigrants | Kenya | 95.4 /100 | #117 | Exceptional 7.3% |
| Serbians | 94.5 /100 | #118 | Exceptional 7.3% |
| South Africans | 94.1 /100 | #119 | Exceptional 7.3% |
| Iraqis | 93.9 /100 | #120 | Exceptional 7.3% |
| Immigrants | Chile | 93.5 /100 | #121 | Exceptional 7.3% |
| Immigrants | Bosnia and Herzegovina | 93.5 /100 | #122 | Exceptional 7.3% |
| Immigrants | Zaire | 93.3 /100 | #123 | Exceptional 7.3% |