Immigrants from Zimbabwe vs Spanish American 5th Grade
COMPARE
Immigrants from Zimbabwe
Spanish American
5th Grade
5th Grade Comparison
Immigrants from Zimbabwe
Spanish Americans
97.6%
5TH GRADE
94.9/ 100
METRIC RATING
120th/ 347
METRIC RANK
97.3%
5TH GRADE
34.7/ 100
METRIC RATING
187th/ 347
METRIC RANK
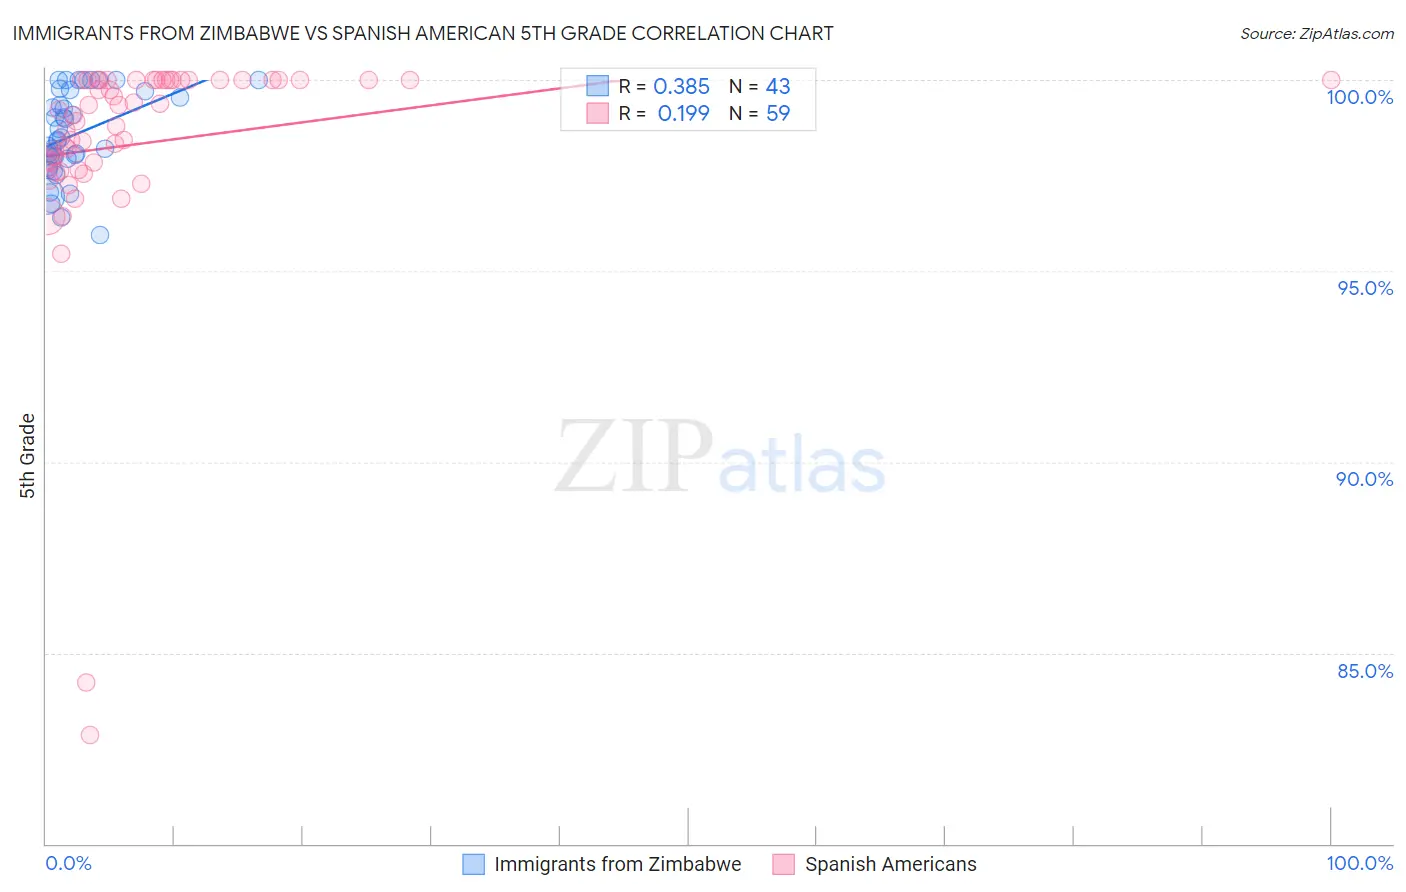
Immigrants from Zimbabwe vs Spanish American 5th Grade Correlation Chart
The statistical analysis conducted on geographies consisting of 117,756,150 people shows a mild positive correlation between the proportion of Immigrants from Zimbabwe and percentage of population with at least 5th grade education in the United States with a correlation coefficient (R) of 0.385 and weighted average of 97.6%. Similarly, the statistical analysis conducted on geographies consisting of 103,168,542 people shows a poor positive correlation between the proportion of Spanish Americans and percentage of population with at least 5th grade education in the United States with a correlation coefficient (R) of 0.199 and weighted average of 97.3%, a difference of 0.37%.
5th Grade Correlation Summary
| Measurement | Immigrants from Zimbabwe | Spanish American |
| Minimum | 95.9% | 82.8% |
| Maximum | 100.0% | 100.0% |
| Range | 4.1% | 17.2% |
| Mean | 98.6% | 98.3% |
| Median | 98.4% | 99.2% |
| Interquartile 25% (IQ1) | 98.0% | 97.8% |
| Interquartile 75% (IQ3) | 99.7% | 100.0% |
| Interquartile Range (IQR) | 1.7% | 2.2% |
| Standard Deviation (Sample) | 1.1% | 3.0% |
| Standard Deviation (Population) | 1.1% | 3.0% |
Similar Demographics by 5th Grade
Demographics Similar to Immigrants from Zimbabwe by 5th Grade
In terms of 5th grade, the demographic groups most similar to Immigrants from Zimbabwe are Syrian (97.6%, a difference of 0.0%), Immigrants from France (97.6%, a difference of 0.0%), Immigrants from Japan (97.6%, a difference of 0.0%), Immigrants from Saudi Arabia (97.6%, a difference of 0.010%), and Basque (97.6%, a difference of 0.010%).
| Demographics | Rating | Rank | 5th Grade |
| Iroquois | 95.9 /100 | #113 | Exceptional 97.7% |
| Lebanese | 95.7 /100 | #114 | Exceptional 97.6% |
| Okinawans | 95.7 /100 | #115 | Exceptional 97.6% |
| Immigrants | Croatia | 95.5 /100 | #116 | Exceptional 97.6% |
| Immigrants | Saudi Arabia | 95.4 /100 | #117 | Exceptional 97.6% |
| Basques | 95.2 /100 | #118 | Exceptional 97.6% |
| Syrians | 95.1 /100 | #119 | Exceptional 97.6% |
| Immigrants | Zimbabwe | 94.9 /100 | #120 | Exceptional 97.6% |
| Immigrants | France | 94.8 /100 | #121 | Exceptional 97.6% |
| Immigrants | Japan | 94.7 /100 | #122 | Exceptional 97.6% |
| Immigrants | Norway | 94.6 /100 | #123 | Exceptional 97.6% |
| Spanish | 93.7 /100 | #124 | Exceptional 97.6% |
| Immigrants | Bulgaria | 93.1 /100 | #125 | Exceptional 97.6% |
| Hmong | 92.3 /100 | #126 | Exceptional 97.6% |
| Immigrants | Serbia | 92.3 /100 | #127 | Exceptional 97.6% |
Demographics Similar to Spanish Americans by 5th Grade
In terms of 5th grade, the demographic groups most similar to Spanish Americans are Paraguayan (97.3%, a difference of 0.0%), Dutch West Indian (97.3%, a difference of 0.010%), Immigrants from Argentina (97.3%, a difference of 0.010%), Immigrants from Egypt (97.3%, a difference of 0.010%), and Black/African American (97.3%, a difference of 0.010%).
| Demographics | Rating | Rank | 5th Grade |
| Pakistanis | 40.2 /100 | #180 | Average 97.3% |
| Argentineans | 39.5 /100 | #181 | Fair 97.3% |
| Mongolians | 39.4 /100 | #182 | Fair 97.3% |
| Immigrants | Ukraine | 38.6 /100 | #183 | Fair 97.3% |
| Immigrants | Venezuela | 38.4 /100 | #184 | Fair 97.3% |
| Dutch West Indians | 36.2 /100 | #185 | Fair 97.3% |
| Immigrants | Argentina | 36.1 /100 | #186 | Fair 97.3% |
| Spanish Americans | 34.7 /100 | #187 | Fair 97.3% |
| Paraguayans | 33.7 /100 | #188 | Fair 97.3% |
| Immigrants | Egypt | 32.9 /100 | #189 | Fair 97.3% |
| Blacks/African Americans | 31.8 /100 | #190 | Fair 97.3% |
| Immigrants | Brazil | 31.5 /100 | #191 | Fair 97.3% |
| Panamanians | 31.3 /100 | #192 | Fair 97.3% |
| Navajo | 29.0 /100 | #193 | Fair 97.2% |
| Immigrants | Albania | 28.5 /100 | #194 | Fair 97.2% |