Immigrants from Ghana vs Spanish American Unemployment Among Women with Children Under 6 years
COMPARE
Immigrants from Ghana
Spanish American
Unemployment Among Women with Children Under 6 years
Unemployment Among Women with Children Under 6 years Comparison
Immigrants from Ghana
Spanish Americans
8.3%
UNEMPLOYMENT AMONG WOMEN WITH CHILDREN UNDER 6 YEARS
0.5/ 100
METRIC RATING
258th/ 347
METRIC RANK
7.7%
UNEMPLOYMENT AMONG WOMEN WITH CHILDREN UNDER 6 YEARS
39.7/ 100
METRIC RATING
185th/ 347
METRIC RANK
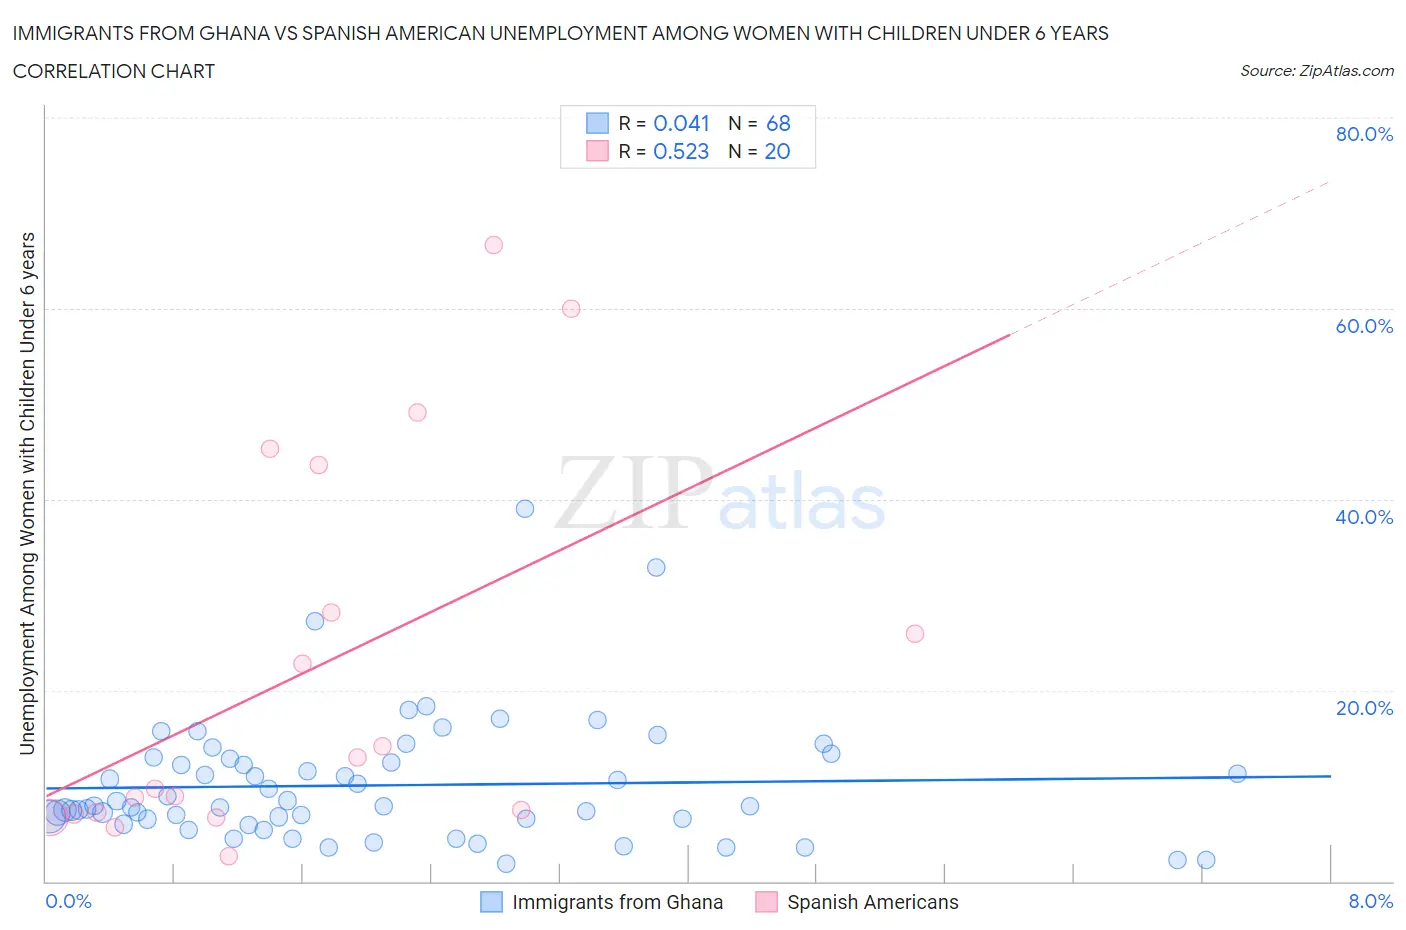
Immigrants from Ghana vs Spanish American Unemployment Among Women with Children Under 6 years Correlation Chart
The statistical analysis conducted on geographies consisting of 171,977,203 people shows no correlation between the proportion of Immigrants from Ghana and unemployment rate among women with children under the age of 6 in the United States with a correlation coefficient (R) of 0.041 and weighted average of 8.3%. Similarly, the statistical analysis conducted on geographies consisting of 94,405,030 people shows a substantial positive correlation between the proportion of Spanish Americans and unemployment rate among women with children under the age of 6 in the United States with a correlation coefficient (R) of 0.523 and weighted average of 7.7%, a difference of 8.1%.
Unemployment Among Women with Children Under 6 years Correlation Summary
| Measurement | Immigrants from Ghana | Spanish American |
| Minimum | 1.8% | 2.6% |
| Maximum | 39.0% | 66.7% |
| Range | 37.2% | 64.1% |
| Mean | 10.0% | 22.0% |
| Median | 7.9% | 11.3% |
| Interquartile 25% (IQ1) | 6.5% | 7.1% |
| Interquartile 75% (IQ3) | 12.6% | 35.9% |
| Interquartile Range (IQR) | 6.1% | 28.7% |
| Standard Deviation (Sample) | 6.6% | 20.1% |
| Standard Deviation (Population) | 6.5% | 19.6% |
Similar Demographics by Unemployment Among Women with Children Under 6 years
Demographics Similar to Immigrants from Ghana by Unemployment Among Women with Children Under 6 years
In terms of unemployment among women with children under 6 years, the demographic groups most similar to Immigrants from Ghana are British West Indian (8.3%, a difference of 0.020%), Celtic (8.3%, a difference of 0.28%), Barbadian (8.3%, a difference of 0.29%), Immigrants from Portugal (8.3%, a difference of 0.30%), and White/Caucasian (8.4%, a difference of 0.55%).
| Demographics | Rating | Rank | Unemployment Among Women with Children Under 6 years |
| Guyanese | 1.0 /100 | #251 | Tragic 8.2% |
| Ghanaians | 1.0 /100 | #252 | Tragic 8.2% |
| Immigrants | Guyana | 0.8 /100 | #253 | Tragic 8.2% |
| Immigrants | Caribbean | 0.7 /100 | #254 | Tragic 8.3% |
| Immigrants | Portugal | 0.6 /100 | #255 | Tragic 8.3% |
| Celtics | 0.6 /100 | #256 | Tragic 8.3% |
| British West Indians | 0.5 /100 | #257 | Tragic 8.3% |
| Immigrants | Ghana | 0.5 /100 | #258 | Tragic 8.3% |
| Barbadians | 0.4 /100 | #259 | Tragic 8.3% |
| Whites/Caucasians | 0.3 /100 | #260 | Tragic 8.4% |
| Immigrants | Liberia | 0.3 /100 | #261 | Tragic 8.4% |
| West Indians | 0.3 /100 | #262 | Tragic 8.4% |
| Scotch-Irish | 0.3 /100 | #263 | Tragic 8.4% |
| Hondurans | 0.3 /100 | #264 | Tragic 8.4% |
| French Canadians | 0.3 /100 | #265 | Tragic 8.4% |
Demographics Similar to Spanish Americans by Unemployment Among Women with Children Under 6 years
In terms of unemployment among women with children under 6 years, the demographic groups most similar to Spanish Americans are Yugoslavian (7.7%, a difference of 0.020%), Indonesian (7.7%, a difference of 0.060%), Immigrants from Thailand (7.7%, a difference of 0.080%), Czechoslovakian (7.7%, a difference of 0.080%), and Sierra Leonean (7.7%, a difference of 0.22%).
| Demographics | Rating | Rank | Unemployment Among Women with Children Under 6 years |
| Immigrants | England | 45.4 /100 | #178 | Average 7.7% |
| Immigrants | Western Europe | 44.9 /100 | #179 | Average 7.7% |
| Immigrants | Uruguay | 44.5 /100 | #180 | Average 7.7% |
| Brazilians | 43.9 /100 | #181 | Average 7.7% |
| Nepalese | 43.5 /100 | #182 | Average 7.7% |
| Sierra Leoneans | 42.9 /100 | #183 | Average 7.7% |
| Indonesians | 40.5 /100 | #184 | Average 7.7% |
| Spanish Americans | 39.7 /100 | #185 | Fair 7.7% |
| Yugoslavians | 39.4 /100 | #186 | Fair 7.7% |
| Immigrants | Thailand | 38.5 /100 | #187 | Fair 7.7% |
| Czechoslovakians | 38.4 /100 | #188 | Fair 7.7% |
| Immigrants | Panama | 35.7 /100 | #189 | Fair 7.7% |
| Immigrants | North Macedonia | 34.4 /100 | #190 | Fair 7.7% |
| Immigrants | Austria | 32.4 /100 | #191 | Fair 7.7% |
| Immigrants | Africa | 32.4 /100 | #192 | Fair 7.7% |