Honduran vs Spanish American Unemployment Among Women with Children Under 6 years
COMPARE
Honduran
Spanish American
Unemployment Among Women with Children Under 6 years
Unemployment Among Women with Children Under 6 years Comparison
Hondurans
Spanish Americans
8.4%
UNEMPLOYMENT AMONG WOMEN WITH CHILDREN UNDER 6 YEARS
0.3/ 100
METRIC RATING
264th/ 347
METRIC RANK
7.7%
UNEMPLOYMENT AMONG WOMEN WITH CHILDREN UNDER 6 YEARS
39.7/ 100
METRIC RATING
185th/ 347
METRIC RANK
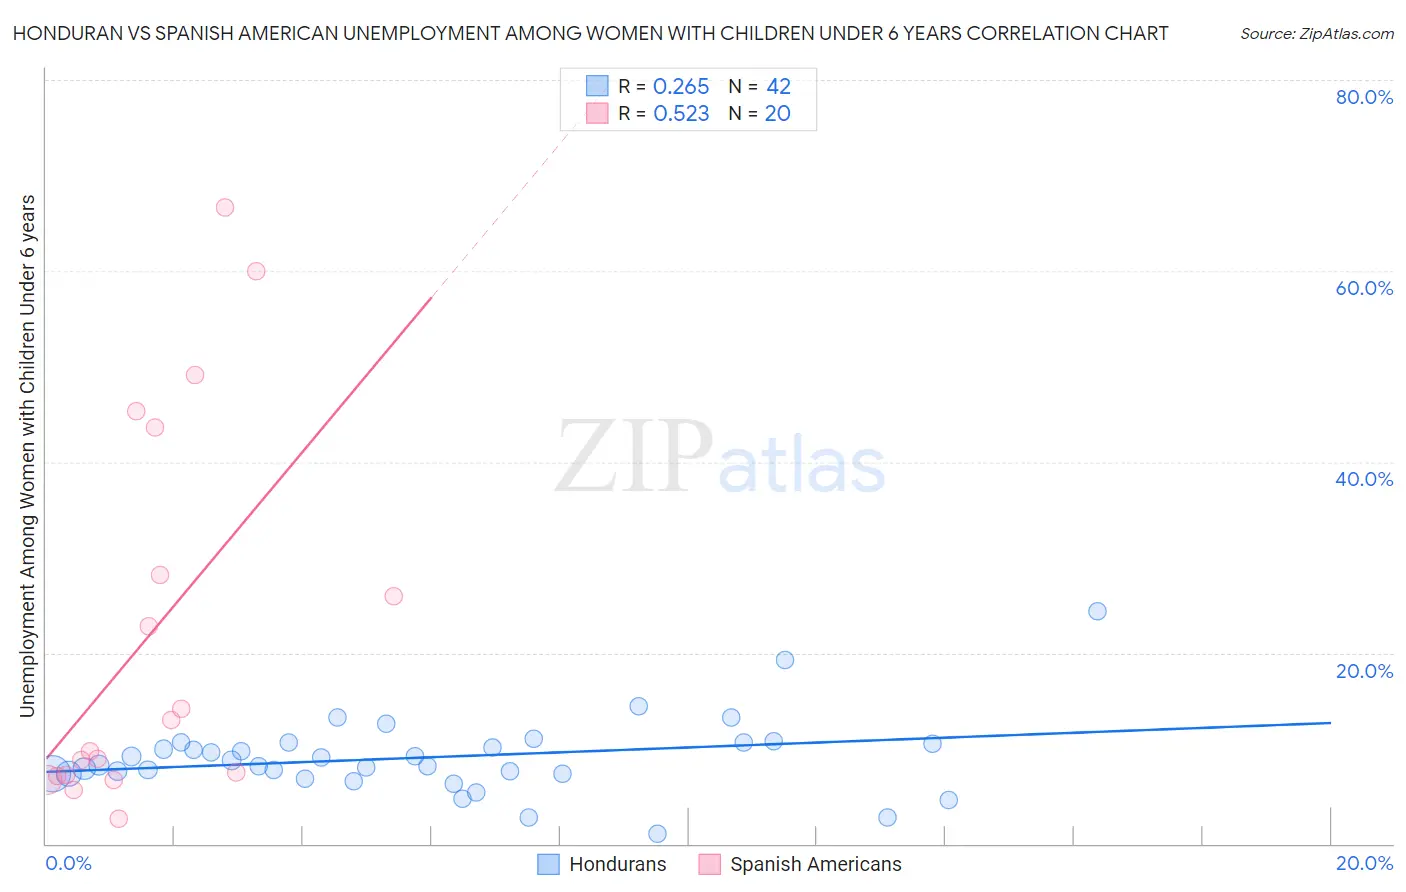
Honduran vs Spanish American Unemployment Among Women with Children Under 6 years Correlation Chart
The statistical analysis conducted on geographies consisting of 285,811,786 people shows a weak positive correlation between the proportion of Hondurans and unemployment rate among women with children under the age of 6 in the United States with a correlation coefficient (R) of 0.265 and weighted average of 8.4%. Similarly, the statistical analysis conducted on geographies consisting of 94,405,030 people shows a substantial positive correlation between the proportion of Spanish Americans and unemployment rate among women with children under the age of 6 in the United States with a correlation coefficient (R) of 0.523 and weighted average of 7.7%, a difference of 9.0%.
Unemployment Among Women with Children Under 6 years Correlation Summary
| Measurement | Honduran | Spanish American |
| Minimum | 1.0% | 2.6% |
| Maximum | 24.3% | 66.7% |
| Range | 23.3% | 64.1% |
| Mean | 9.0% | 22.0% |
| Median | 8.5% | 11.3% |
| Interquartile 25% (IQ1) | 7.3% | 7.1% |
| Interquartile 75% (IQ3) | 10.6% | 35.9% |
| Interquartile Range (IQR) | 3.2% | 28.7% |
| Standard Deviation (Sample) | 4.0% | 20.1% |
| Standard Deviation (Population) | 4.0% | 19.6% |
Similar Demographics by Unemployment Among Women with Children Under 6 years
Demographics Similar to Hondurans by Unemployment Among Women with Children Under 6 years
In terms of unemployment among women with children under 6 years, the demographic groups most similar to Hondurans are Scotch-Irish (8.4%, a difference of 0.020%), West Indian (8.4%, a difference of 0.050%), French Canadian (8.4%, a difference of 0.050%), Immigrants from Honduras (8.4%, a difference of 0.050%), and Immigrants from Liberia (8.4%, a difference of 0.060%).
| Demographics | Rating | Rank | Unemployment Among Women with Children Under 6 years |
| British West Indians | 0.5 /100 | #257 | Tragic 8.3% |
| Immigrants | Ghana | 0.5 /100 | #258 | Tragic 8.3% |
| Barbadians | 0.4 /100 | #259 | Tragic 8.3% |
| Whites/Caucasians | 0.3 /100 | #260 | Tragic 8.4% |
| Immigrants | Liberia | 0.3 /100 | #261 | Tragic 8.4% |
| West Indians | 0.3 /100 | #262 | Tragic 8.4% |
| Scotch-Irish | 0.3 /100 | #263 | Tragic 8.4% |
| Hondurans | 0.3 /100 | #264 | Tragic 8.4% |
| French Canadians | 0.3 /100 | #265 | Tragic 8.4% |
| Immigrants | Honduras | 0.3 /100 | #266 | Tragic 8.4% |
| Belizeans | 0.2 /100 | #267 | Tragic 8.4% |
| Sub-Saharan Africans | 0.2 /100 | #268 | Tragic 8.4% |
| Immigrants | Haiti | 0.2 /100 | #269 | Tragic 8.4% |
| Immigrants | Senegal | 0.2 /100 | #270 | Tragic 8.5% |
| Immigrants | Congo | 0.2 /100 | #271 | Tragic 8.5% |
Demographics Similar to Spanish Americans by Unemployment Among Women with Children Under 6 years
In terms of unemployment among women with children under 6 years, the demographic groups most similar to Spanish Americans are Yugoslavian (7.7%, a difference of 0.020%), Indonesian (7.7%, a difference of 0.060%), Immigrants from Thailand (7.7%, a difference of 0.080%), Czechoslovakian (7.7%, a difference of 0.080%), and Sierra Leonean (7.7%, a difference of 0.22%).
| Demographics | Rating | Rank | Unemployment Among Women with Children Under 6 years |
| Immigrants | England | 45.4 /100 | #178 | Average 7.7% |
| Immigrants | Western Europe | 44.9 /100 | #179 | Average 7.7% |
| Immigrants | Uruguay | 44.5 /100 | #180 | Average 7.7% |
| Brazilians | 43.9 /100 | #181 | Average 7.7% |
| Nepalese | 43.5 /100 | #182 | Average 7.7% |
| Sierra Leoneans | 42.9 /100 | #183 | Average 7.7% |
| Indonesians | 40.5 /100 | #184 | Average 7.7% |
| Spanish Americans | 39.7 /100 | #185 | Fair 7.7% |
| Yugoslavians | 39.4 /100 | #186 | Fair 7.7% |
| Immigrants | Thailand | 38.5 /100 | #187 | Fair 7.7% |
| Czechoslovakians | 38.4 /100 | #188 | Fair 7.7% |
| Immigrants | Panama | 35.7 /100 | #189 | Fair 7.7% |
| Immigrants | North Macedonia | 34.4 /100 | #190 | Fair 7.7% |
| Immigrants | Austria | 32.4 /100 | #191 | Fair 7.7% |
| Immigrants | Africa | 32.4 /100 | #192 | Fair 7.7% |