Immigrants from Latvia vs Colville Unemployment Among Ages 65 to 74 years
COMPARE
Immigrants from Latvia
Colville
Unemployment Among Ages 65 to 74 years
Unemployment Among Ages 65 to 74 years Comparison
Immigrants from Latvia
Colville
5.3%
UNEMPLOYMENT AMONG AGES 65 TO 74 YEARS
74.6/ 100
METRIC RATING
147th/ 347
METRIC RANK
5.4%
UNEMPLOYMENT AMONG AGES 65 TO 74 YEARS
20.4/ 100
METRIC RATING
197th/ 347
METRIC RANK
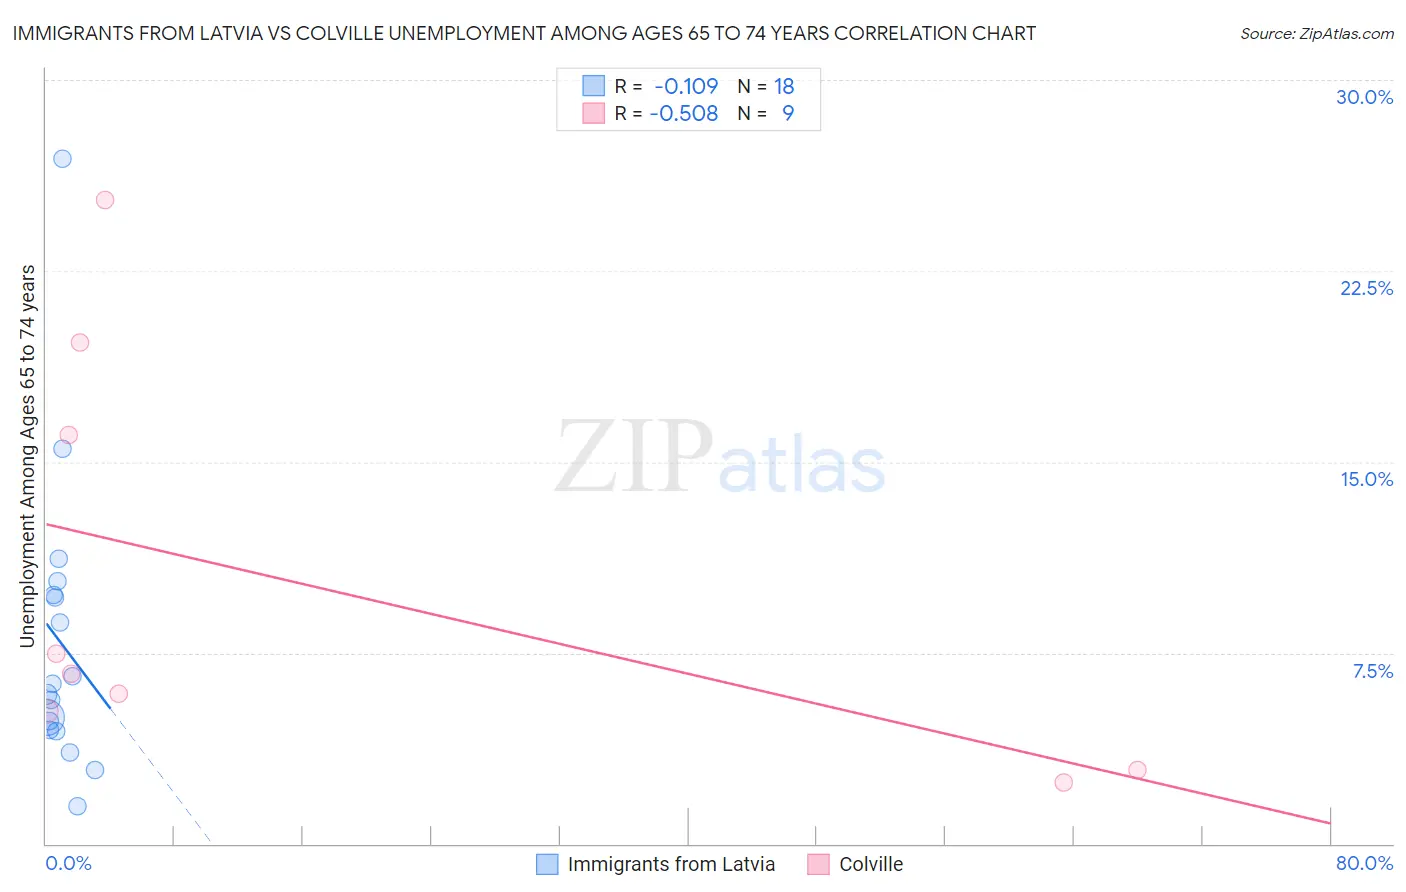
Immigrants from Latvia vs Colville Unemployment Among Ages 65 to 74 years Correlation Chart
The statistical analysis conducted on geographies consisting of 108,700,333 people shows a poor negative correlation between the proportion of Immigrants from Latvia and unemployment rate among population between the ages 65 and 74 in the United States with a correlation coefficient (R) of -0.109 and weighted average of 5.3%. Similarly, the statistical analysis conducted on geographies consisting of 33,027,474 people shows a substantial negative correlation between the proportion of Colville and unemployment rate among population between the ages 65 and 74 in the United States with a correlation coefficient (R) of -0.508 and weighted average of 5.4%, a difference of 2.1%.
Unemployment Among Ages 65 to 74 years Correlation Summary
| Measurement | Immigrants from Latvia | Colville |
| Minimum | 1.5% | 2.4% |
| Maximum | 26.9% | 25.3% |
| Range | 25.4% | 22.9% |
| Mean | 7.9% | 10.2% |
| Median | 6.1% | 6.7% |
| Interquartile 25% (IQ1) | 4.5% | 4.0% |
| Interquartile 75% (IQ3) | 9.8% | 17.9% |
| Interquartile Range (IQR) | 5.3% | 13.8% |
| Standard Deviation (Sample) | 5.9% | 8.1% |
| Standard Deviation (Population) | 5.7% | 7.7% |
Similar Demographics by Unemployment Among Ages 65 to 74 years
Demographics Similar to Immigrants from Latvia by Unemployment Among Ages 65 to 74 years
In terms of unemployment among ages 65 to 74 years, the demographic groups most similar to Immigrants from Latvia are Irish (5.3%, a difference of 0.010%), Canadian (5.3%, a difference of 0.020%), Immigrants from Sri Lanka (5.3%, a difference of 0.040%), Immigrants from Romania (5.3%, a difference of 0.050%), and Immigrants from Poland (5.3%, a difference of 0.060%).
| Demographics | Rating | Rank | Unemployment Among Ages 65 to 74 years |
| Immigrants | Laos | 78.6 /100 | #140 | Good 5.3% |
| Immigrants | Asia | 78.4 /100 | #141 | Good 5.3% |
| Turks | 76.2 /100 | #142 | Good 5.3% |
| New Zealanders | 76.1 /100 | #143 | Good 5.3% |
| Immigrants | Chile | 76.0 /100 | #144 | Good 5.3% |
| Canadians | 75.0 /100 | #145 | Good 5.3% |
| Irish | 74.8 /100 | #146 | Good 5.3% |
| Immigrants | Latvia | 74.6 /100 | #147 | Good 5.3% |
| Immigrants | Sri Lanka | 73.8 /100 | #148 | Good 5.3% |
| Immigrants | Romania | 73.5 /100 | #149 | Good 5.3% |
| Immigrants | Poland | 73.2 /100 | #150 | Good 5.3% |
| Immigrants | Indonesia | 72.9 /100 | #151 | Good 5.3% |
| Spanish | 72.6 /100 | #152 | Good 5.3% |
| Immigrants | Cabo Verde | 72.5 /100 | #153 | Good 5.3% |
| Poles | 72.4 /100 | #154 | Good 5.3% |
Demographics Similar to Colville by Unemployment Among Ages 65 to 74 years
In terms of unemployment among ages 65 to 74 years, the demographic groups most similar to Colville are Costa Rican (5.4%, a difference of 0.030%), Albanian (5.4%, a difference of 0.14%), Immigrants from China (5.4%, a difference of 0.18%), Immigrants from Denmark (5.4%, a difference of 0.20%), and Immigrants from Belgium (5.4%, a difference of 0.23%).
| Demographics | Rating | Rank | Unemployment Among Ages 65 to 74 years |
| Basques | 26.6 /100 | #190 | Fair 5.4% |
| Immigrants | Egypt | 26.5 /100 | #191 | Fair 5.4% |
| Maltese | 26.4 /100 | #192 | Fair 5.4% |
| Cherokee | 25.8 /100 | #193 | Fair 5.4% |
| Immigrants | Denmark | 24.7 /100 | #194 | Fair 5.4% |
| Immigrants | China | 24.2 /100 | #195 | Fair 5.4% |
| Costa Ricans | 21.1 /100 | #196 | Fair 5.4% |
| Colville | 20.4 /100 | #197 | Fair 5.4% |
| Albanians | 17.8 /100 | #198 | Poor 5.4% |
| Immigrants | Belgium | 16.2 /100 | #199 | Poor 5.4% |
| Immigrants | Pakistan | 15.2 /100 | #200 | Poor 5.4% |
| Immigrants | Western Asia | 14.9 /100 | #201 | Poor 5.4% |
| Sub-Saharan Africans | 14.4 /100 | #202 | Poor 5.4% |
| Argentineans | 14.3 /100 | #203 | Poor 5.4% |
| Seminole | 14.3 /100 | #204 | Poor 5.4% |