Immigrants from Zimbabwe vs Chippewa Unemployment Among Ages 65 to 74 years
COMPARE
Immigrants from Zimbabwe
Chippewa
Unemployment Among Ages 65 to 74 years
Unemployment Among Ages 65 to 74 years Comparison
Immigrants from Zimbabwe
Chippewa
5.1%
UNEMPLOYMENT AMONG AGES 65 TO 74 YEARS
99.7/ 100
METRIC RATING
50th/ 347
METRIC RANK
5.7%
UNEMPLOYMENT AMONG AGES 65 TO 74 YEARS
0.1/ 100
METRIC RATING
284th/ 347
METRIC RANK
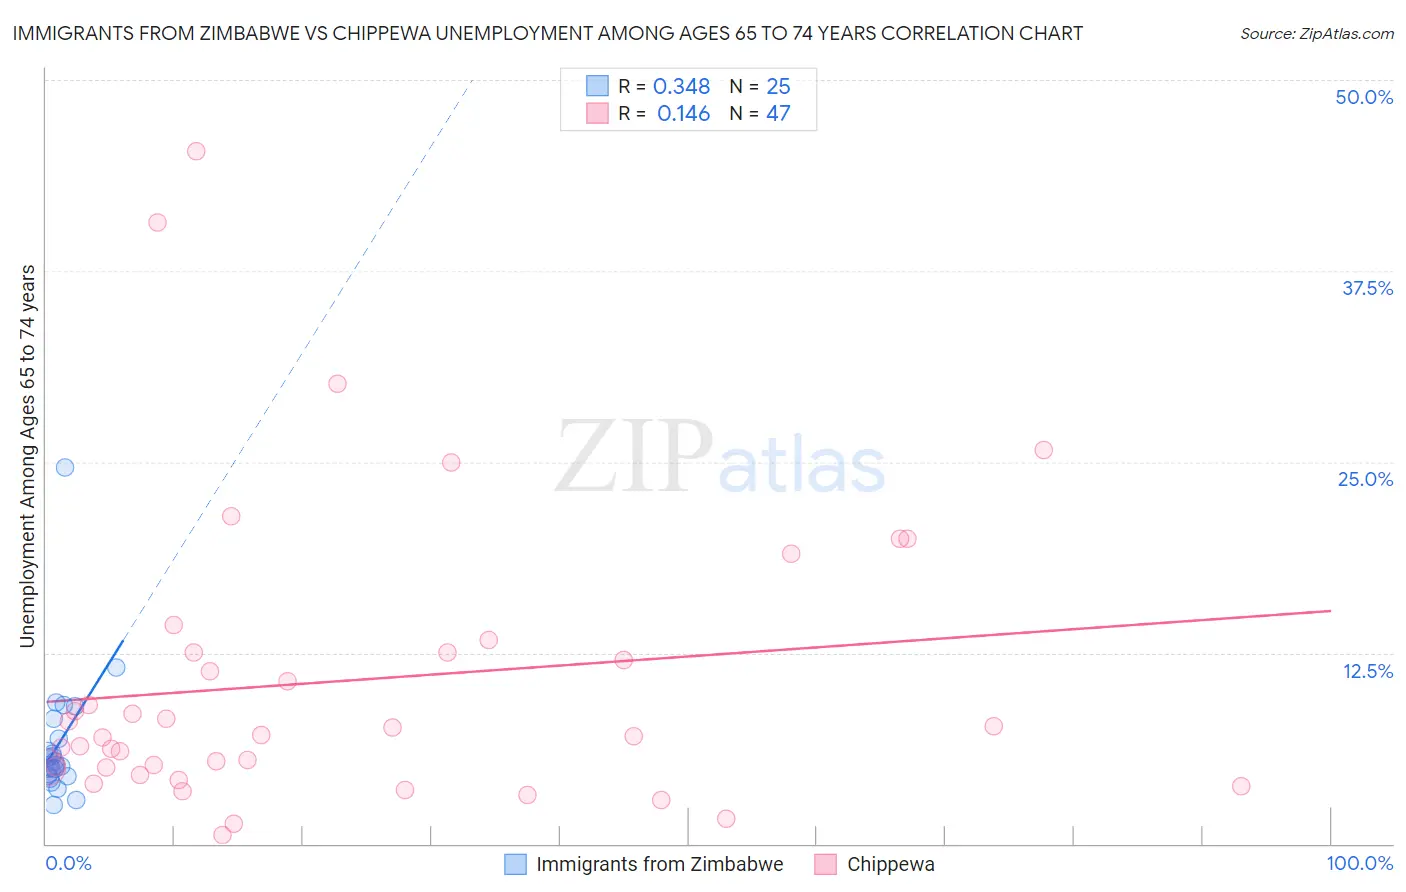
Immigrants from Zimbabwe vs Chippewa Unemployment Among Ages 65 to 74 years Correlation Chart
The statistical analysis conducted on geographies consisting of 113,363,139 people shows a mild positive correlation between the proportion of Immigrants from Zimbabwe and unemployment rate among population between the ages 65 and 74 in the United States with a correlation coefficient (R) of 0.348 and weighted average of 5.1%. Similarly, the statistical analysis conducted on geographies consisting of 190,997,990 people shows a poor positive correlation between the proportion of Chippewa and unemployment rate among population between the ages 65 and 74 in the United States with a correlation coefficient (R) of 0.146 and weighted average of 5.7%, a difference of 11.6%.
Unemployment Among Ages 65 to 74 years Correlation Summary
| Measurement | Immigrants from Zimbabwe | Chippewa |
| Minimum | 2.5% | 0.60% |
| Maximum | 24.6% | 45.3% |
| Range | 22.1% | 44.7% |
| Mean | 6.5% | 10.7% |
| Median | 5.2% | 7.1% |
| Interquartile 25% (IQ1) | 4.4% | 5.0% |
| Interquartile 75% (IQ3) | 7.5% | 12.5% |
| Interquartile Range (IQR) | 3.1% | 7.5% |
| Standard Deviation (Sample) | 4.3% | 9.7% |
| Standard Deviation (Population) | 4.2% | 9.6% |
Similar Demographics by Unemployment Among Ages 65 to 74 years
Demographics Similar to Immigrants from Zimbabwe by Unemployment Among Ages 65 to 74 years
In terms of unemployment among ages 65 to 74 years, the demographic groups most similar to Immigrants from Zimbabwe are Immigrants from Kazakhstan (5.1%, a difference of 0.020%), Immigrants from Austria (5.1%, a difference of 0.16%), Choctaw (5.1%, a difference of 0.18%), European (5.1%, a difference of 0.29%), and Immigrants from Ethiopia (5.1%, a difference of 0.29%).
| Demographics | Rating | Rank | Unemployment Among Ages 65 to 74 years |
| Assyrians/Chaldeans/Syriacs | 99.9 /100 | #43 | Exceptional 5.1% |
| Immigrants | India | 99.9 /100 | #44 | Exceptional 5.1% |
| Sioux | 99.8 /100 | #45 | Exceptional 5.1% |
| Immigrants | Kenya | 99.8 /100 | #46 | Exceptional 5.1% |
| Immigrants | Uganda | 99.8 /100 | #47 | Exceptional 5.1% |
| Choctaw | 99.8 /100 | #48 | Exceptional 5.1% |
| Immigrants | Austria | 99.8 /100 | #49 | Exceptional 5.1% |
| Immigrants | Zimbabwe | 99.7 /100 | #50 | Exceptional 5.1% |
| Immigrants | Kazakhstan | 99.7 /100 | #51 | Exceptional 5.1% |
| Europeans | 99.6 /100 | #52 | Exceptional 5.1% |
| Immigrants | Ethiopia | 99.6 /100 | #53 | Exceptional 5.1% |
| Immigrants | Nicaragua | 99.6 /100 | #54 | Exceptional 5.1% |
| Carpatho Rusyns | 99.6 /100 | #55 | Exceptional 5.1% |
| Swedes | 99.5 /100 | #56 | Exceptional 5.1% |
| Croatians | 99.5 /100 | #57 | Exceptional 5.1% |
Demographics Similar to Chippewa by Unemployment Among Ages 65 to 74 years
In terms of unemployment among ages 65 to 74 years, the demographic groups most similar to Chippewa are Cypriot (5.7%, a difference of 0.010%), Ottawa (5.7%, a difference of 0.040%), Immigrants from Sierra Leone (5.7%, a difference of 0.050%), Immigrants from West Indies (5.7%, a difference of 0.080%), and Marshallese (5.7%, a difference of 0.080%).
| Demographics | Rating | Rank | Unemployment Among Ages 65 to 74 years |
| Immigrants | South America | 0.1 /100 | #277 | Tragic 5.7% |
| Mexican American Indians | 0.1 /100 | #278 | Tragic 5.7% |
| Immigrants | Norway | 0.1 /100 | #279 | Tragic 5.7% |
| Moroccans | 0.1 /100 | #280 | Tragic 5.7% |
| Immigrants | West Indies | 0.1 /100 | #281 | Tragic 5.7% |
| Ottawa | 0.1 /100 | #282 | Tragic 5.7% |
| Cypriots | 0.1 /100 | #283 | Tragic 5.7% |
| Chippewa | 0.1 /100 | #284 | Tragic 5.7% |
| Immigrants | Sierra Leone | 0.1 /100 | #285 | Tragic 5.7% |
| Marshallese | 0.1 /100 | #286 | Tragic 5.7% |
| Central American Indians | 0.0 /100 | #287 | Tragic 5.7% |
| Central Americans | 0.0 /100 | #288 | Tragic 5.7% |
| Immigrants | Somalia | 0.0 /100 | #289 | Tragic 5.7% |
| Spanish American Indians | 0.0 /100 | #290 | Tragic 5.7% |
| Portuguese | 0.0 /100 | #291 | Tragic 5.7% |