Immigrants from Zimbabwe vs Armenian College, 1 year or more
COMPARE
Immigrants from Zimbabwe
Armenian
College, 1 year or more
College, 1 year or more Comparison
Immigrants from Zimbabwe
Armenians
63.3%
COLLEGE, 1 YEAR OR MORE
99.3/ 100
METRIC RATING
69th/ 347
METRIC RANK
63.0%
COLLEGE, 1 YEAR OR MORE
98.9/ 100
METRIC RATING
75th/ 347
METRIC RANK
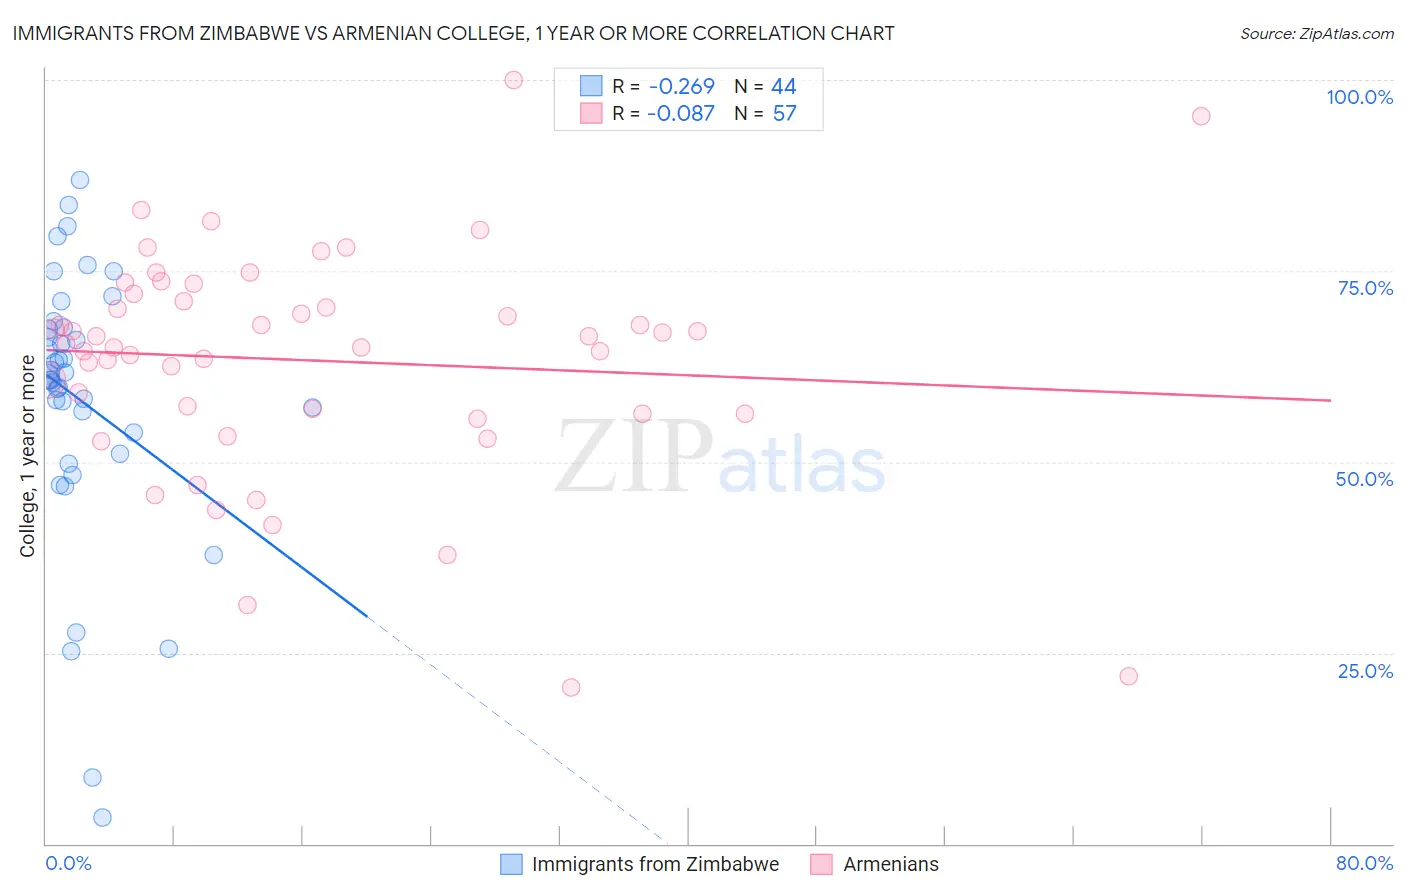
Immigrants from Zimbabwe vs Armenian College, 1 year or more Correlation Chart
The statistical analysis conducted on geographies consisting of 117,809,864 people shows a weak negative correlation between the proportion of Immigrants from Zimbabwe and percentage of population with at least college, 1 year or more education in the United States with a correlation coefficient (R) of -0.269 and weighted average of 63.3%. Similarly, the statistical analysis conducted on geographies consisting of 310,952,439 people shows a slight negative correlation between the proportion of Armenians and percentage of population with at least college, 1 year or more education in the United States with a correlation coefficient (R) of -0.087 and weighted average of 63.0%, a difference of 0.45%.
College, 1 year or more Correlation Summary
| Measurement | Immigrants from Zimbabwe | Armenian |
| Minimum | 3.5% | 20.5% |
| Maximum | 87.0% | 100.0% |
| Range | 83.5% | 79.5% |
| Mean | 58.0% | 63.3% |
| Median | 60.9% | 65.4% |
| Interquartile 25% (IQ1) | 52.5% | 56.3% |
| Interquartile 75% (IQ3) | 67.5% | 71.5% |
| Interquartile Range (IQR) | 15.0% | 15.2% |
| Standard Deviation (Sample) | 17.9% | 15.0% |
| Standard Deviation (Population) | 17.7% | 14.9% |
Demographics Similar to Immigrants from Zimbabwe and Armenians by College, 1 year or more
In terms of college, 1 year or more, the demographic groups most similar to Immigrants from Zimbabwe are Immigrants from Greece (63.3%, a difference of 0.0%), Immigrants from Romania (63.3%, a difference of 0.020%), Immigrants from Europe (63.3%, a difference of 0.040%), Argentinean (63.2%, a difference of 0.10%), and Maltese (63.4%, a difference of 0.14%). Similarly, the demographic groups most similar to Armenians are Immigrants from North America (63.0%, a difference of 0.090%), Paraguayan (62.9%, a difference of 0.10%), Ethiopian (62.9%, a difference of 0.10%), Immigrants from Moldova (63.0%, a difference of 0.11%), and Egyptian (63.1%, a difference of 0.12%).
| Demographics | Rating | Rank | College, 1 year or more |
| Immigrants | Indonesia | 99.5 /100 | #62 | Exceptional 63.5% |
| Immigrants | Scotland | 99.4 /100 | #63 | Exceptional 63.4% |
| Immigrants | Spain | 99.4 /100 | #64 | Exceptional 63.4% |
| Maltese | 99.3 /100 | #65 | Exceptional 63.4% |
| Immigrants | Europe | 99.3 /100 | #66 | Exceptional 63.3% |
| Immigrants | Romania | 99.3 /100 | #67 | Exceptional 63.3% |
| Immigrants | Greece | 99.3 /100 | #68 | Exceptional 63.3% |
| Immigrants | Zimbabwe | 99.3 /100 | #69 | Exceptional 63.3% |
| Argentineans | 99.2 /100 | #70 | Exceptional 63.2% |
| Immigrants | Canada | 99.1 /100 | #71 | Exceptional 63.1% |
| Egyptians | 99.0 /100 | #72 | Exceptional 63.1% |
| Immigrants | Moldova | 99.0 /100 | #73 | Exceptional 63.0% |
| Immigrants | North America | 99.0 /100 | #74 | Exceptional 63.0% |
| Armenians | 98.9 /100 | #75 | Exceptional 63.0% |
| Paraguayans | 98.8 /100 | #76 | Exceptional 62.9% |
| Ethiopians | 98.8 /100 | #77 | Exceptional 62.9% |
| Immigrants | Lebanon | 98.8 /100 | #78 | Exceptional 62.9% |
| Northern Europeans | 98.8 /100 | #79 | Exceptional 62.9% |
| Lithuanians | 98.8 /100 | #80 | Exceptional 62.9% |
| Laotians | 98.7 /100 | #81 | Exceptional 62.8% |
| Immigrants | Bolivia | 98.7 /100 | #82 | Exceptional 62.8% |