Immigrants from South Central Asia vs Armenian Unemployment Among Women with Children Under 6 years
COMPARE
Immigrants from South Central Asia
Armenian
Unemployment Among Women with Children Under 6 years
Unemployment Among Women with Children Under 6 years Comparison
Immigrants from South Central Asia
Armenians
6.6%
UNEMPLOYMENT AMONG WOMEN WITH CHILDREN UNDER 6 YEARS
100.0/ 100
METRIC RATING
34th/ 347
METRIC RANK
7.2%
UNEMPLOYMENT AMONG WOMEN WITH CHILDREN UNDER 6 YEARS
95.9/ 100
METRIC RATING
116th/ 347
METRIC RANK
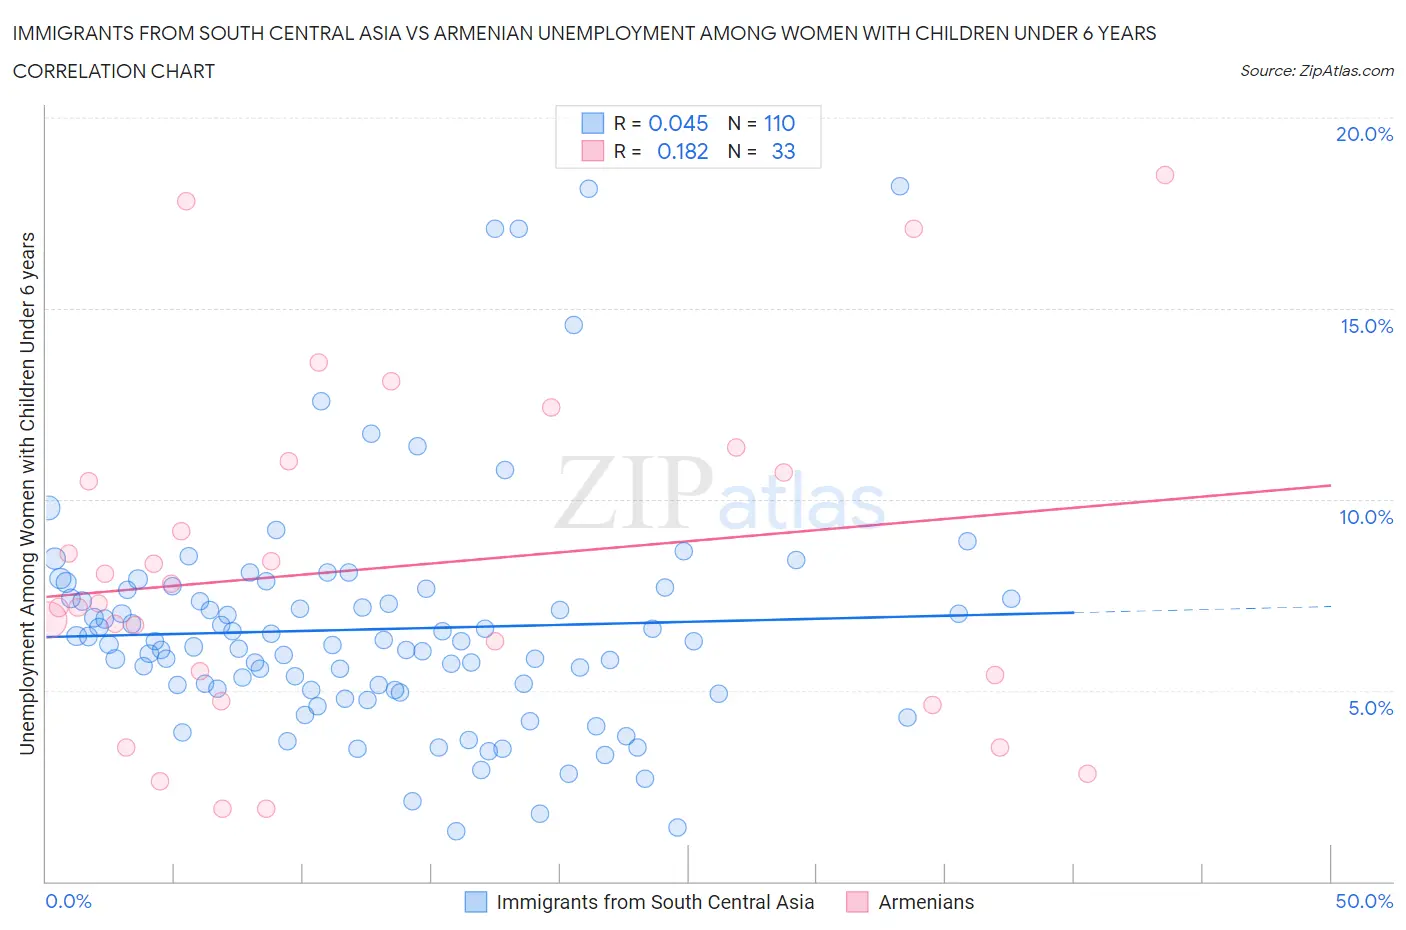
Immigrants from South Central Asia vs Armenian Unemployment Among Women with Children Under 6 years Correlation Chart
The statistical analysis conducted on geographies consisting of 345,035,256 people shows no correlation between the proportion of Immigrants from South Central Asia and unemployment rate among women with children under the age of 6 in the United States with a correlation coefficient (R) of 0.045 and weighted average of 6.6%. Similarly, the statistical analysis conducted on geographies consisting of 243,507,724 people shows a poor positive correlation between the proportion of Armenians and unemployment rate among women with children under the age of 6 in the United States with a correlation coefficient (R) of 0.182 and weighted average of 7.2%, a difference of 9.7%.
Unemployment Among Women with Children Under 6 years Correlation Summary
| Measurement | Immigrants from South Central Asia | Armenian |
| Minimum | 1.3% | 1.9% |
| Maximum | 18.2% | 18.5% |
| Range | 16.9% | 16.6% |
| Mean | 6.6% | 8.2% |
| Median | 6.2% | 7.3% |
| Interquartile 25% (IQ1) | 5.0% | 5.0% |
| Interquartile 75% (IQ3) | 7.4% | 10.8% |
| Interquartile Range (IQR) | 2.4% | 5.8% |
| Standard Deviation (Sample) | 3.1% | 4.4% |
| Standard Deviation (Population) | 3.0% | 4.3% |
Similar Demographics by Unemployment Among Women with Children Under 6 years
Demographics Similar to Immigrants from South Central Asia by Unemployment Among Women with Children Under 6 years
In terms of unemployment among women with children under 6 years, the demographic groups most similar to Immigrants from South Central Asia are Immigrants from Vietnam (6.6%, a difference of 0.010%), Tsimshian (6.6%, a difference of 0.030%), Immigrants from Moldova (6.6%, a difference of 0.090%), Yakama (6.6%, a difference of 0.27%), and Luxembourger (6.6%, a difference of 0.34%).
| Demographics | Rating | Rank | Unemployment Among Women with Children Under 6 years |
| Immigrants | Japan | 100.0 /100 | #27 | Exceptional 6.5% |
| Immigrants | Israel | 100.0 /100 | #28 | Exceptional 6.5% |
| Immigrants | Sweden | 100.0 /100 | #29 | Exceptional 6.6% |
| Immigrants | Belarus | 100.0 /100 | #30 | Exceptional 6.6% |
| Immigrants | Moldova | 100.0 /100 | #31 | Exceptional 6.6% |
| Tsimshian | 100.0 /100 | #32 | Exceptional 6.6% |
| Immigrants | Vietnam | 100.0 /100 | #33 | Exceptional 6.6% |
| Immigrants | South Central Asia | 100.0 /100 | #34 | Exceptional 6.6% |
| Yakama | 100.0 /100 | #35 | Exceptional 6.6% |
| Luxembourgers | 100.0 /100 | #36 | Exceptional 6.6% |
| Sri Lankans | 100.0 /100 | #37 | Exceptional 6.6% |
| Hmong | 100.0 /100 | #38 | Exceptional 6.7% |
| Immigrants | Russia | 100.0 /100 | #39 | Exceptional 6.7% |
| Asians | 100.0 /100 | #40 | Exceptional 6.7% |
| Immigrants | Indonesia | 99.9 /100 | #41 | Exceptional 6.7% |
Demographics Similar to Armenians by Unemployment Among Women with Children Under 6 years
In terms of unemployment among women with children under 6 years, the demographic groups most similar to Armenians are Immigrants from Italy (7.2%, a difference of 0.10%), Argentinean (7.2%, a difference of 0.17%), Immigrants from Kenya (7.3%, a difference of 0.21%), Nicaraguan (7.2%, a difference of 0.22%), and Israeli (7.2%, a difference of 0.30%).
| Demographics | Rating | Rank | Unemployment Among Women with Children Under 6 years |
| Australians | 96.9 /100 | #109 | Exceptional 7.2% |
| Palestinians | 96.8 /100 | #110 | Exceptional 7.2% |
| Norwegians | 96.7 /100 | #111 | Exceptional 7.2% |
| Israelis | 96.5 /100 | #112 | Exceptional 7.2% |
| Nicaraguans | 96.3 /100 | #113 | Exceptional 7.2% |
| Argentineans | 96.2 /100 | #114 | Exceptional 7.2% |
| Immigrants | Italy | 96.1 /100 | #115 | Exceptional 7.2% |
| Armenians | 95.9 /100 | #116 | Exceptional 7.2% |
| Immigrants | Kenya | 95.4 /100 | #117 | Exceptional 7.3% |
| Serbians | 94.5 /100 | #118 | Exceptional 7.3% |
| South Africans | 94.1 /100 | #119 | Exceptional 7.3% |
| Iraqis | 93.9 /100 | #120 | Exceptional 7.3% |
| Immigrants | Chile | 93.5 /100 | #121 | Exceptional 7.3% |
| Immigrants | Bosnia and Herzegovina | 93.5 /100 | #122 | Exceptional 7.3% |
| Immigrants | Zaire | 93.3 /100 | #123 | Exceptional 7.3% |