Immigrants from Uruguay vs Armenian Unemployment Among Women with Children Under 6 years
COMPARE
Immigrants from Uruguay
Armenian
Unemployment Among Women with Children Under 6 years
Unemployment Among Women with Children Under 6 years Comparison
Immigrants from Uruguay
Armenians
7.7%
UNEMPLOYMENT AMONG WOMEN WITH CHILDREN UNDER 6 YEARS
44.5/ 100
METRIC RATING
180th/ 347
METRIC RANK
7.2%
UNEMPLOYMENT AMONG WOMEN WITH CHILDREN UNDER 6 YEARS
95.9/ 100
METRIC RATING
116th/ 347
METRIC RANK
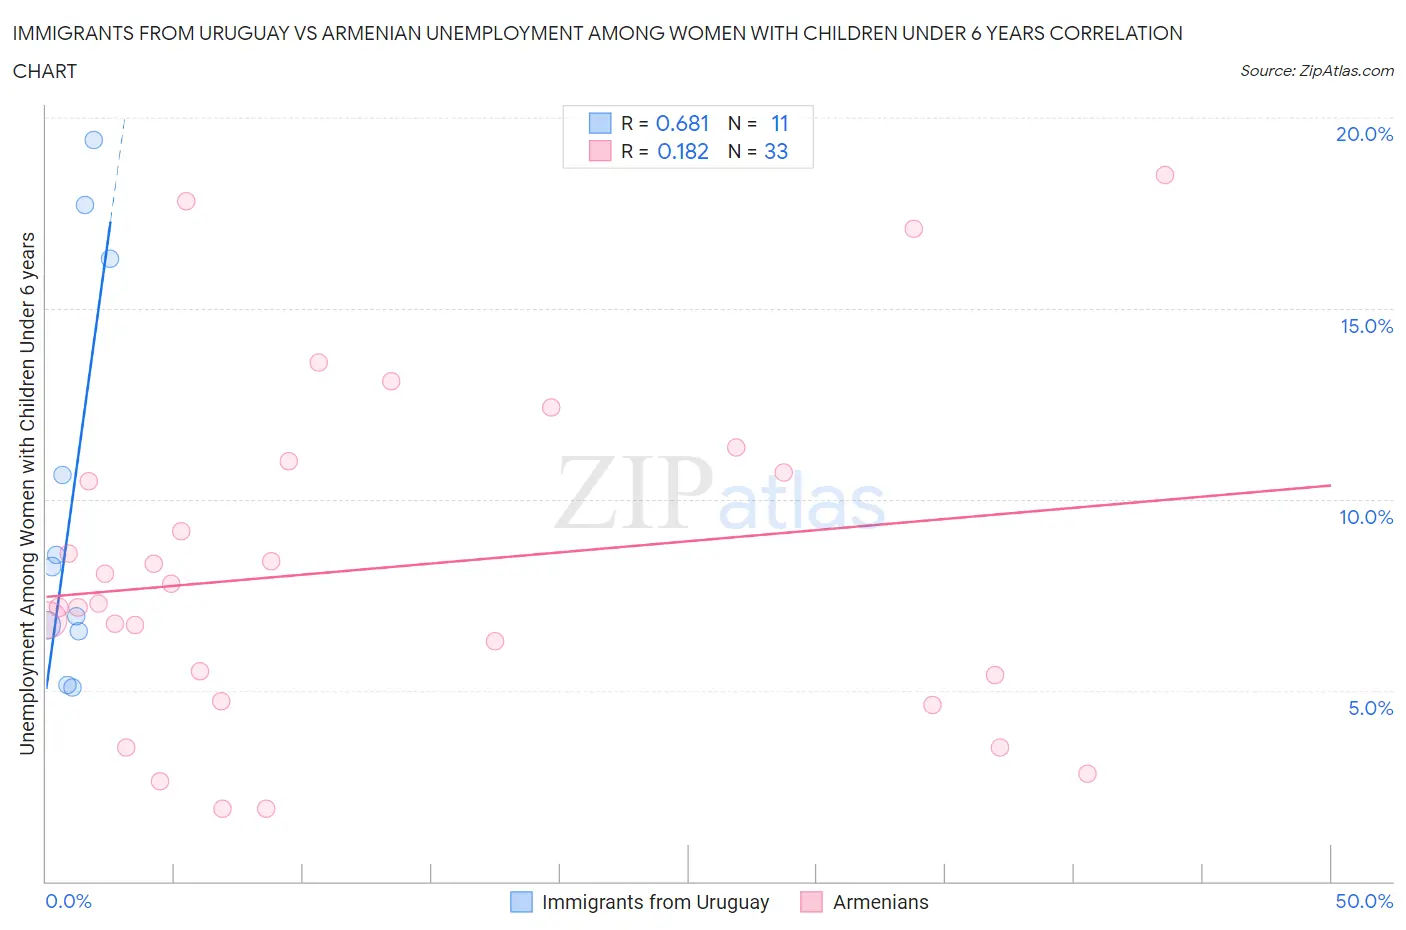
Immigrants from Uruguay vs Armenian Unemployment Among Women with Children Under 6 years Correlation Chart
The statistical analysis conducted on geographies consisting of 118,165,185 people shows a significant positive correlation between the proportion of Immigrants from Uruguay and unemployment rate among women with children under the age of 6 in the United States with a correlation coefficient (R) of 0.681 and weighted average of 7.7%. Similarly, the statistical analysis conducted on geographies consisting of 243,507,724 people shows a poor positive correlation between the proportion of Armenians and unemployment rate among women with children under the age of 6 in the United States with a correlation coefficient (R) of 0.182 and weighted average of 7.2%, a difference of 5.9%.
Unemployment Among Women with Children Under 6 years Correlation Summary
| Measurement | Immigrants from Uruguay | Armenian |
| Minimum | 5.1% | 1.9% |
| Maximum | 19.4% | 18.5% |
| Range | 14.3% | 16.6% |
| Mean | 10.1% | 8.2% |
| Median | 8.2% | 7.3% |
| Interquartile 25% (IQ1) | 6.6% | 5.0% |
| Interquartile 75% (IQ3) | 16.3% | 10.8% |
| Interquartile Range (IQR) | 9.7% | 5.8% |
| Standard Deviation (Sample) | 5.2% | 4.4% |
| Standard Deviation (Population) | 5.0% | 4.3% |
Similar Demographics by Unemployment Among Women with Children Under 6 years
Demographics Similar to Immigrants from Uruguay by Unemployment Among Women with Children Under 6 years
In terms of unemployment among women with children under 6 years, the demographic groups most similar to Immigrants from Uruguay are Immigrants from Western Europe (7.7%, a difference of 0.030%), Brazilian (7.7%, a difference of 0.040%), Immigrants from England (7.7%, a difference of 0.060%), Nepalese (7.7%, a difference of 0.060%), and Austrian (7.7%, a difference of 0.10%).
| Demographics | Rating | Rank | Unemployment Among Women with Children Under 6 years |
| Cree | 51.6 /100 | #173 | Average 7.6% |
| Immigrants | Laos | 50.0 /100 | #174 | Average 7.6% |
| Panamanians | 49.6 /100 | #175 | Average 7.6% |
| Puget Sound Salish | 47.7 /100 | #176 | Average 7.7% |
| Austrians | 46.0 /100 | #177 | Average 7.7% |
| Immigrants | England | 45.4 /100 | #178 | Average 7.7% |
| Immigrants | Western Europe | 44.9 /100 | #179 | Average 7.7% |
| Immigrants | Uruguay | 44.5 /100 | #180 | Average 7.7% |
| Brazilians | 43.9 /100 | #181 | Average 7.7% |
| Nepalese | 43.5 /100 | #182 | Average 7.7% |
| Sierra Leoneans | 42.9 /100 | #183 | Average 7.7% |
| Indonesians | 40.5 /100 | #184 | Average 7.7% |
| Spanish Americans | 39.7 /100 | #185 | Fair 7.7% |
| Yugoslavians | 39.4 /100 | #186 | Fair 7.7% |
| Immigrants | Thailand | 38.5 /100 | #187 | Fair 7.7% |
Demographics Similar to Armenians by Unemployment Among Women with Children Under 6 years
In terms of unemployment among women with children under 6 years, the demographic groups most similar to Armenians are Immigrants from Italy (7.2%, a difference of 0.10%), Argentinean (7.2%, a difference of 0.17%), Immigrants from Kenya (7.3%, a difference of 0.21%), Nicaraguan (7.2%, a difference of 0.22%), and Israeli (7.2%, a difference of 0.30%).
| Demographics | Rating | Rank | Unemployment Among Women with Children Under 6 years |
| Australians | 96.9 /100 | #109 | Exceptional 7.2% |
| Palestinians | 96.8 /100 | #110 | Exceptional 7.2% |
| Norwegians | 96.7 /100 | #111 | Exceptional 7.2% |
| Israelis | 96.5 /100 | #112 | Exceptional 7.2% |
| Nicaraguans | 96.3 /100 | #113 | Exceptional 7.2% |
| Argentineans | 96.2 /100 | #114 | Exceptional 7.2% |
| Immigrants | Italy | 96.1 /100 | #115 | Exceptional 7.2% |
| Armenians | 95.9 /100 | #116 | Exceptional 7.2% |
| Immigrants | Kenya | 95.4 /100 | #117 | Exceptional 7.3% |
| Serbians | 94.5 /100 | #118 | Exceptional 7.3% |
| South Africans | 94.1 /100 | #119 | Exceptional 7.3% |
| Iraqis | 93.9 /100 | #120 | Exceptional 7.3% |
| Immigrants | Chile | 93.5 /100 | #121 | Exceptional 7.3% |
| Immigrants | Bosnia and Herzegovina | 93.5 /100 | #122 | Exceptional 7.3% |
| Immigrants | Zaire | 93.3 /100 | #123 | Exceptional 7.3% |