Armenian vs Pima Unemployment Among Ages 16 to 19 years
COMPARE
Armenian
Pima
Unemployment Among Ages 16 to 19 years
Unemployment Among Ages 16 to 19 years Comparison
Armenians
Pima
20.5%
UNEMPLOYMENT AMONG AGES 16 TO 19 YEARS
0.0/ 100
METRIC RATING
296th/ 347
METRIC RANK
23.1%
UNEMPLOYMENT AMONG AGES 16 TO 19 YEARS
0.0/ 100
METRIC RATING
327th/ 347
METRIC RANK
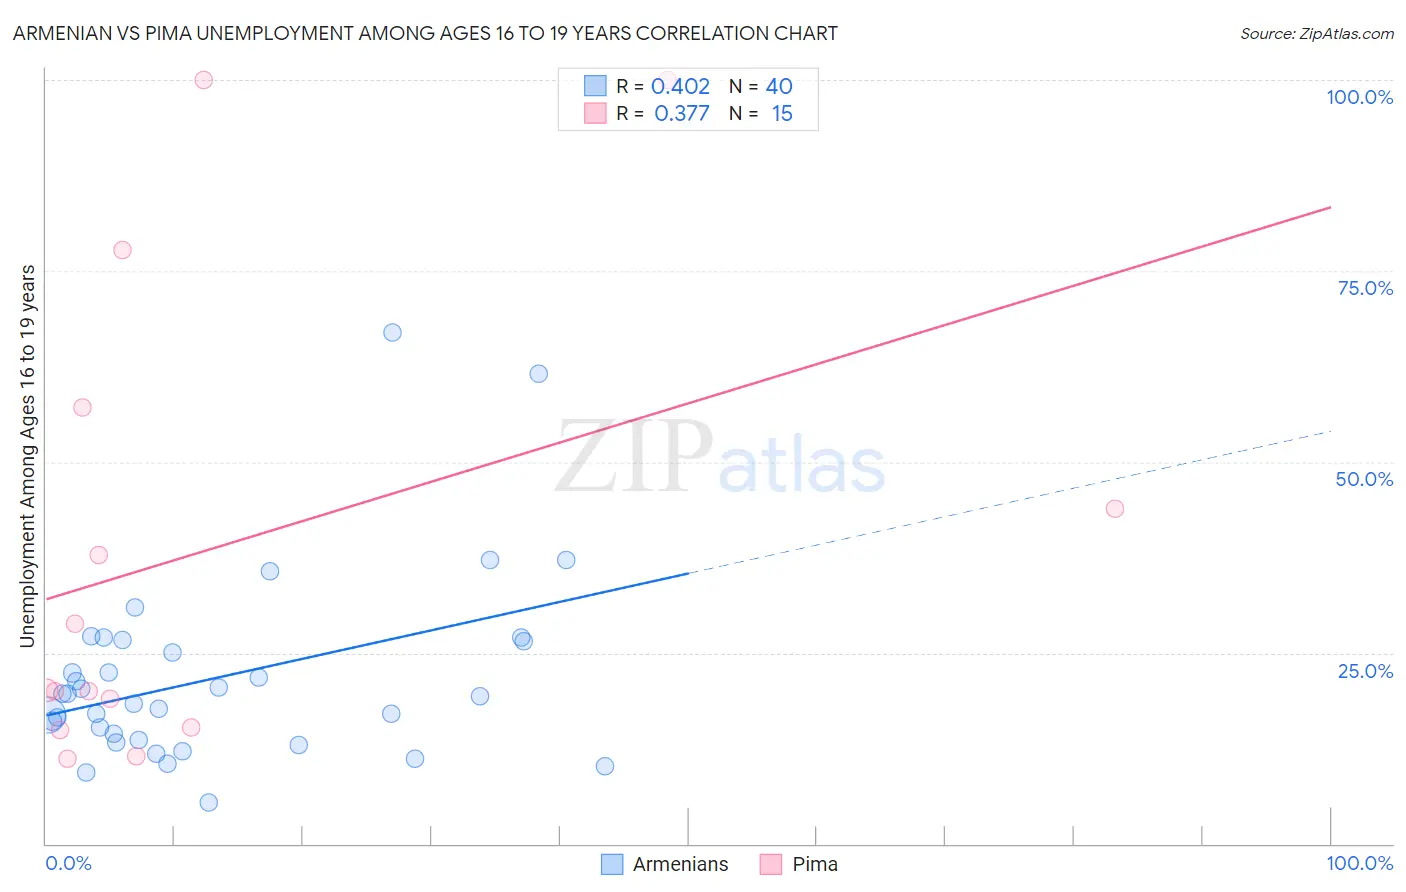
Armenian vs Pima Unemployment Among Ages 16 to 19 years Correlation Chart
The statistical analysis conducted on geographies consisting of 296,100,961 people shows a moderate positive correlation between the proportion of Armenians and unemployment rate among population between the ages 16 and 19 in the United States with a correlation coefficient (R) of 0.402 and weighted average of 20.5%. Similarly, the statistical analysis conducted on geographies consisting of 60,760,058 people shows a mild positive correlation between the proportion of Pima and unemployment rate among population between the ages 16 and 19 in the United States with a correlation coefficient (R) of 0.377 and weighted average of 23.1%, a difference of 12.9%.
Unemployment Among Ages 16 to 19 years Correlation Summary
| Measurement | Armenian | Pima |
| Minimum | 5.4% | 11.1% |
| Maximum | 67.0% | 100.0% |
| Range | 61.6% | 88.9% |
| Mean | 21.9% | 38.5% |
| Median | 19.4% | 20.1% |
| Interquartile 25% (IQ1) | 14.0% | 15.3% |
| Interquartile 75% (IQ3) | 26.6% | 57.1% |
| Interquartile Range (IQR) | 12.6% | 41.8% |
| Standard Deviation (Sample) | 12.4% | 31.1% |
| Standard Deviation (Population) | 12.2% | 30.1% |
Similar Demographics by Unemployment Among Ages 16 to 19 years
Demographics Similar to Armenians by Unemployment Among Ages 16 to 19 years
In terms of unemployment among ages 16 to 19 years, the demographic groups most similar to Armenians are Alsatian (20.5%, a difference of 0.030%), Haitian (20.5%, a difference of 0.080%), Immigrants from Uzbekistan (20.5%, a difference of 0.13%), Ecuadorian (20.5%, a difference of 0.22%), and Central American Indian (20.4%, a difference of 0.29%).
| Demographics | Rating | Rank | Unemployment Among Ages 16 to 19 years |
| Pueblo | 0.0 /100 | #289 | Tragic 19.8% |
| Immigrants | Sierra Leone | 0.0 /100 | #290 | Tragic 20.0% |
| Immigrants | Yemen | 0.0 /100 | #291 | Tragic 20.0% |
| Comanche | 0.0 /100 | #292 | Tragic 20.2% |
| Immigrants | Bahamas | 0.0 /100 | #293 | Tragic 20.4% |
| Immigrants | Haiti | 0.0 /100 | #294 | Tragic 20.4% |
| Central American Indians | 0.0 /100 | #295 | Tragic 20.4% |
| Armenians | 0.0 /100 | #296 | Tragic 20.5% |
| Alsatians | 0.0 /100 | #297 | Tragic 20.5% |
| Haitians | 0.0 /100 | #298 | Tragic 20.5% |
| Immigrants | Uzbekistan | 0.0 /100 | #299 | Tragic 20.5% |
| Ecuadorians | 0.0 /100 | #300 | Tragic 20.5% |
| Immigrants | Ecuador | 0.0 /100 | #301 | Tragic 20.9% |
| Immigrants | Caribbean | 0.0 /100 | #302 | Tragic 20.9% |
| Senegalese | 0.0 /100 | #303 | Tragic 21.0% |
Demographics Similar to Pima by Unemployment Among Ages 16 to 19 years
In terms of unemployment among ages 16 to 19 years, the demographic groups most similar to Pima are Immigrants from Trinidad and Tobago (23.1%, a difference of 0.26%), Immigrants from Dominican Republic (23.3%, a difference of 0.66%), Tlingit-Haida (23.5%, a difference of 1.7%), Dominican (23.6%, a difference of 2.2%), and Trinidadian and Tobagonian (22.6%, a difference of 2.3%).
| Demographics | Rating | Rank | Unemployment Among Ages 16 to 19 years |
| Cheyenne | 0.0 /100 | #320 | Tragic 22.3% |
| West Indians | 0.0 /100 | #321 | Tragic 22.4% |
| Barbadians | 0.0 /100 | #322 | Tragic 22.5% |
| Yakama | 0.0 /100 | #323 | Tragic 22.5% |
| Immigrants | Armenia | 0.0 /100 | #324 | Tragic 22.6% |
| Trinidadians and Tobagonians | 0.0 /100 | #325 | Tragic 22.6% |
| Immigrants | Trinidad and Tobago | 0.0 /100 | #326 | Tragic 23.1% |
| Pima | 0.0 /100 | #327 | Tragic 23.1% |
| Immigrants | Dominican Republic | 0.0 /100 | #328 | Tragic 23.3% |
| Tlingit-Haida | 0.0 /100 | #329 | Tragic 23.5% |
| Dominicans | 0.0 /100 | #330 | Tragic 23.6% |
| British West Indians | 0.0 /100 | #331 | Tragic 24.0% |
| Immigrants | Barbados | 0.0 /100 | #332 | Tragic 24.0% |
| Paiute | 0.0 /100 | #333 | Tragic 24.4% |
| Guyanese | 0.0 /100 | #334 | Tragic 24.8% |