Vietnamese vs Pima Unemployment Among Ages 16 to 19 years
COMPARE
Vietnamese
Pima
Unemployment Among Ages 16 to 19 years
Unemployment Among Ages 16 to 19 years Comparison
Vietnamese
Pima
21.5%
UNEMPLOYMENT AMONG AGES 16 TO 19 YEARS
0.0/ 100
METRIC RATING
310th/ 347
METRIC RANK
23.1%
UNEMPLOYMENT AMONG AGES 16 TO 19 YEARS
0.0/ 100
METRIC RATING
327th/ 347
METRIC RANK
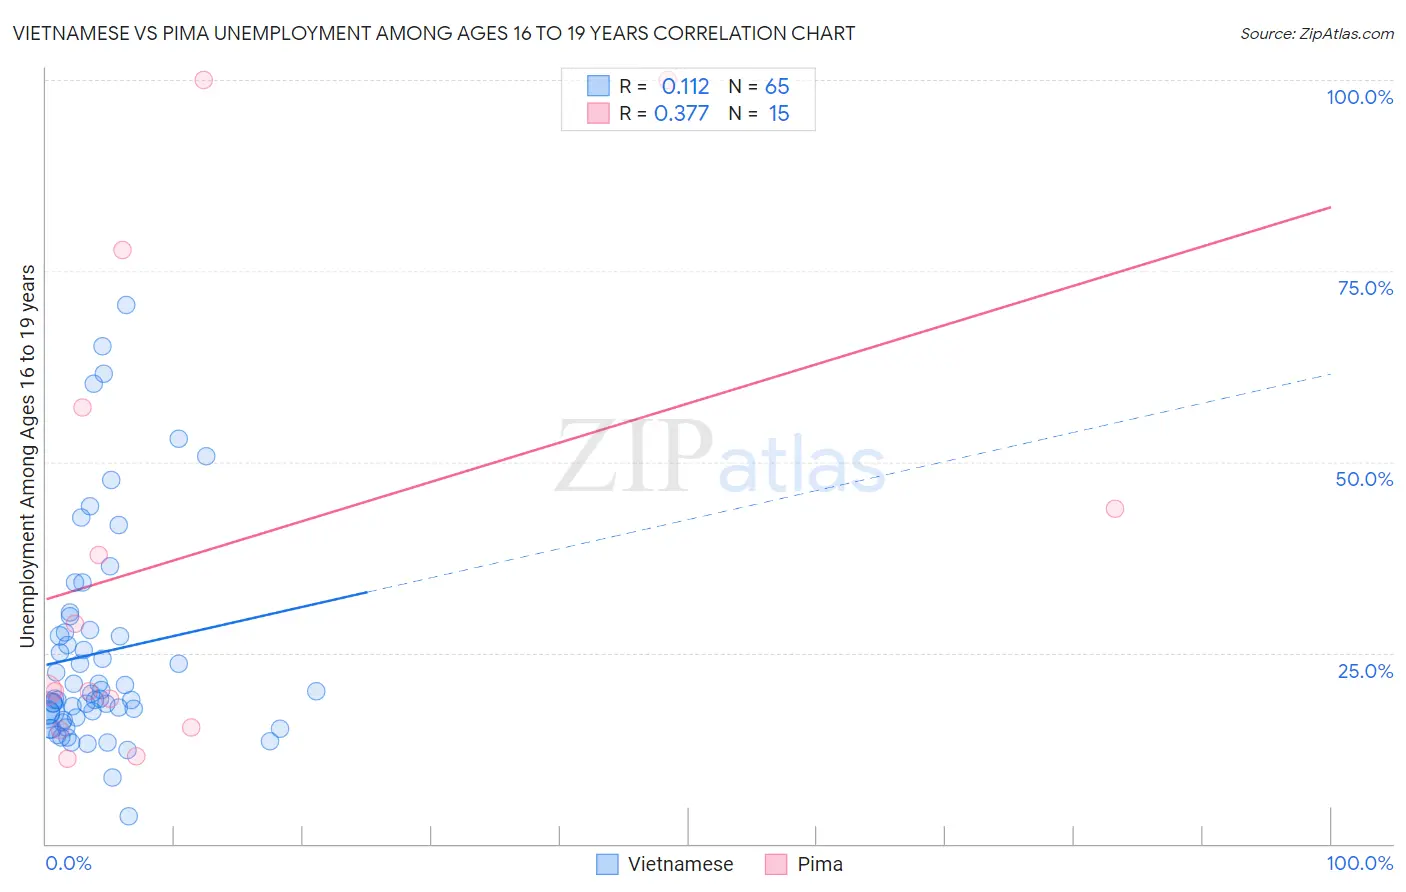
Vietnamese vs Pima Unemployment Among Ages 16 to 19 years Correlation Chart
The statistical analysis conducted on geographies consisting of 167,034,023 people shows a poor positive correlation between the proportion of Vietnamese and unemployment rate among population between the ages 16 and 19 in the United States with a correlation coefficient (R) of 0.112 and weighted average of 21.5%. Similarly, the statistical analysis conducted on geographies consisting of 60,760,058 people shows a mild positive correlation between the proportion of Pima and unemployment rate among population between the ages 16 and 19 in the United States with a correlation coefficient (R) of 0.377 and weighted average of 23.1%, a difference of 7.5%.
Unemployment Among Ages 16 to 19 years Correlation Summary
| Measurement | Vietnamese | Pima |
| Minimum | 3.6% | 11.1% |
| Maximum | 70.6% | 100.0% |
| Range | 67.0% | 88.9% |
| Mean | 25.0% | 38.5% |
| Median | 19.0% | 20.1% |
| Interquartile 25% (IQ1) | 16.4% | 15.3% |
| Interquartile 75% (IQ3) | 27.9% | 57.1% |
| Interquartile Range (IQR) | 11.5% | 41.8% |
| Standard Deviation (Sample) | 14.2% | 31.1% |
| Standard Deviation (Population) | 14.1% | 30.1% |
Demographics Similar to Vietnamese and Pima by Unemployment Among Ages 16 to 19 years
In terms of unemployment among ages 16 to 19 years, the demographic groups most similar to Vietnamese are Native/Alaskan (21.5%, a difference of 0.060%), Immigrants from Bangladesh (21.5%, a difference of 0.22%), Belizean (21.6%, a difference of 0.22%), Houma (21.6%, a difference of 0.48%), and Jamaican (21.7%, a difference of 0.89%). Similarly, the demographic groups most similar to Pima are Immigrants from Trinidad and Tobago (23.1%, a difference of 0.26%), Immigrants from Dominican Republic (23.3%, a difference of 0.66%), Trinidadian and Tobagonian (22.6%, a difference of 2.3%), Immigrants from Armenia (22.6%, a difference of 2.4%), and Yakama (22.5%, a difference of 2.8%).
| Demographics | Rating | Rank | Unemployment Among Ages 16 to 19 years |
| Immigrants | Bangladesh | 0.0 /100 | #308 | Tragic 21.5% |
| Natives/Alaskans | 0.0 /100 | #309 | Tragic 21.5% |
| Vietnamese | 0.0 /100 | #310 | Tragic 21.5% |
| Belizeans | 0.0 /100 | #311 | Tragic 21.6% |
| Houma | 0.0 /100 | #312 | Tragic 21.6% |
| Jamaicans | 0.0 /100 | #313 | Tragic 21.7% |
| Alaska Natives | 0.0 /100 | #314 | Tragic 21.8% |
| Immigrants | Dominica | 0.0 /100 | #315 | Tragic 21.9% |
| Tohono O'odham | 0.0 /100 | #316 | Tragic 22.1% |
| Immigrants | Belize | 0.0 /100 | #317 | Tragic 22.2% |
| Immigrants | Jamaica | 0.0 /100 | #318 | Tragic 22.2% |
| Immigrants | West Indies | 0.0 /100 | #319 | Tragic 22.2% |
| Cheyenne | 0.0 /100 | #320 | Tragic 22.3% |
| West Indians | 0.0 /100 | #321 | Tragic 22.4% |
| Barbadians | 0.0 /100 | #322 | Tragic 22.5% |
| Yakama | 0.0 /100 | #323 | Tragic 22.5% |
| Immigrants | Armenia | 0.0 /100 | #324 | Tragic 22.6% |
| Trinidadians and Tobagonians | 0.0 /100 | #325 | Tragic 22.6% |
| Immigrants | Trinidad and Tobago | 0.0 /100 | #326 | Tragic 23.1% |
| Pima | 0.0 /100 | #327 | Tragic 23.1% |
| Immigrants | Dominican Republic | 0.0 /100 | #328 | Tragic 23.3% |