Immigrants from Western Europe vs Slavic Unemployment Among Ages 60 to 64 years
COMPARE
Immigrants from Western Europe
Slavic
Unemployment Among Ages 60 to 64 years
Unemployment Among Ages 60 to 64 years Comparison
Immigrants from Western Europe
Slavs
4.9%
UNEMPLOYMENT AMONG AGES 60 TO 64 YEARS
50.0/ 100
METRIC RATING
174th/ 347
METRIC RANK
4.6%
UNEMPLOYMENT AMONG AGES 60 TO 64 YEARS
99.5/ 100
METRIC RATING
71st/ 347
METRIC RANK
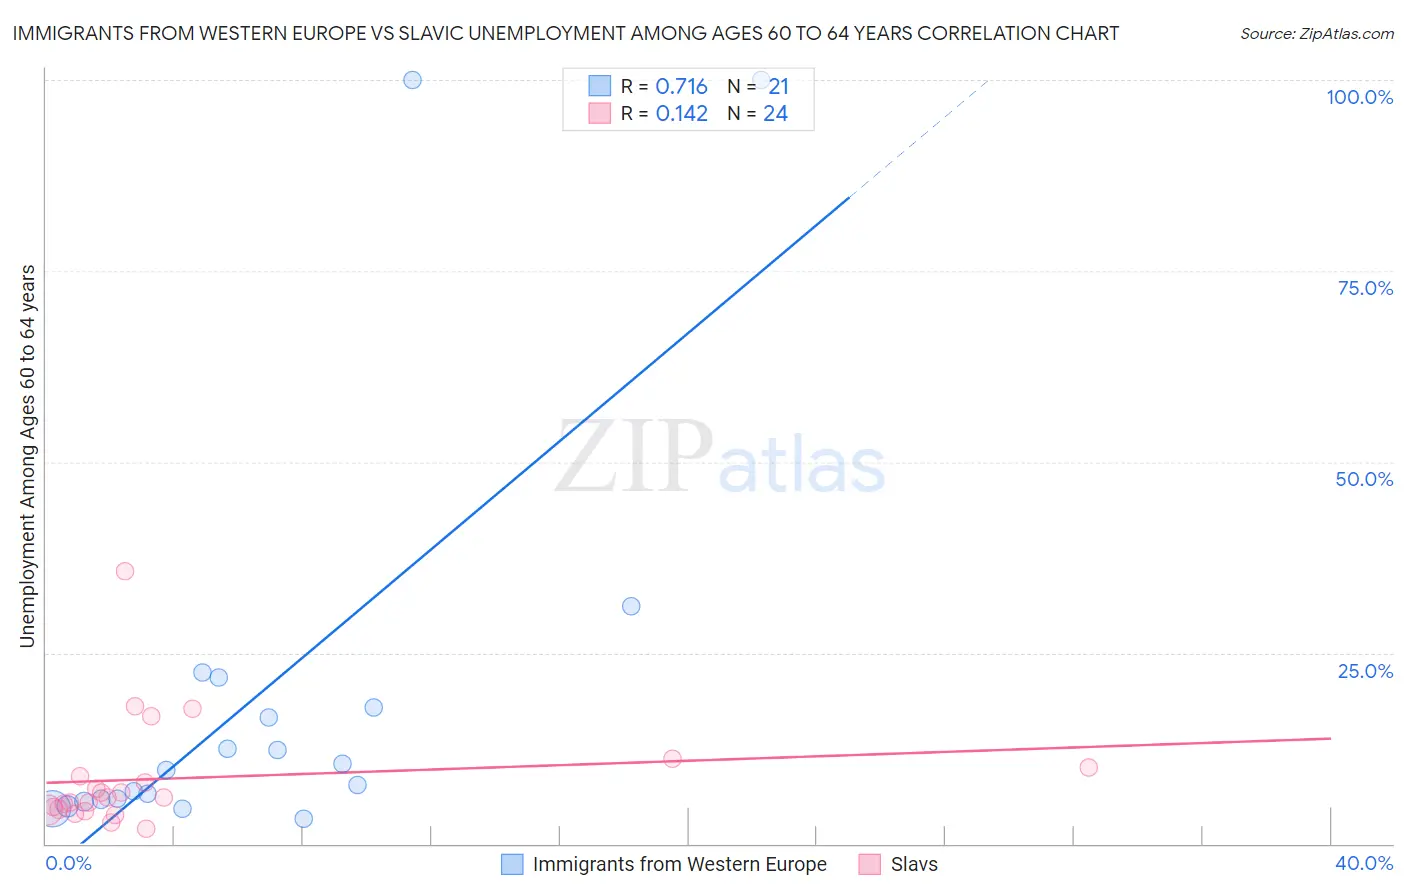
Immigrants from Western Europe vs Slavic Unemployment Among Ages 60 to 64 years Correlation Chart
The statistical analysis conducted on geographies consisting of 428,692,856 people shows a strong positive correlation between the proportion of Immigrants from Western Europe and unemployment rate among population between the ages 60 and 64 in the United States with a correlation coefficient (R) of 0.716 and weighted average of 4.9%. Similarly, the statistical analysis conducted on geographies consisting of 250,860,466 people shows a poor positive correlation between the proportion of Slavs and unemployment rate among population between the ages 60 and 64 in the United States with a correlation coefficient (R) of 0.142 and weighted average of 4.6%, a difference of 4.9%.
Unemployment Among Ages 60 to 64 years Correlation Summary
| Measurement | Immigrants from Western Europe | Slavic |
| Minimum | 3.3% | 1.9% |
| Maximum | 100.0% | 35.7% |
| Range | 96.7% | 33.8% |
| Mean | 19.5% | 8.5% |
| Median | 9.7% | 6.0% |
| Interquartile 25% (IQ1) | 5.7% | 4.4% |
| Interquartile 75% (IQ3) | 19.8% | 9.4% |
| Interquartile Range (IQR) | 14.1% | 4.9% |
| Standard Deviation (Sample) | 27.7% | 7.3% |
| Standard Deviation (Population) | 27.0% | 7.1% |
Similar Demographics by Unemployment Among Ages 60 to 64 years
Demographics Similar to Immigrants from Western Europe by Unemployment Among Ages 60 to 64 years
In terms of unemployment among ages 60 to 64 years, the demographic groups most similar to Immigrants from Western Europe are Immigrants from Hungary (4.9%, a difference of 0.010%), Immigrants from Turkey (4.9%, a difference of 0.10%), Immigrants from Latvia (4.9%, a difference of 0.11%), Bermudan (4.9%, a difference of 0.12%), and Samoan (4.9%, a difference of 0.13%).
| Demographics | Rating | Rank | Unemployment Among Ages 60 to 64 years |
| Immigrants | Northern Europe | 59.1 /100 | #167 | Average 4.8% |
| Immigrants | Southern Europe | 56.7 /100 | #168 | Average 4.8% |
| Immigrants | France | 55.5 /100 | #169 | Average 4.8% |
| Immigrants | Korea | 54.2 /100 | #170 | Average 4.8% |
| Samoans | 53.6 /100 | #171 | Average 4.9% |
| Immigrants | Turkey | 52.8 /100 | #172 | Average 4.9% |
| Immigrants | Hungary | 50.2 /100 | #173 | Average 4.9% |
| Immigrants | Western Europe | 50.0 /100 | #174 | Average 4.9% |
| Immigrants | Latvia | 46.9 /100 | #175 | Average 4.9% |
| Bermudans | 46.5 /100 | #176 | Average 4.9% |
| Immigrants | Malaysia | 44.7 /100 | #177 | Average 4.9% |
| Immigrants | Nonimmigrants | 44.5 /100 | #178 | Average 4.9% |
| Immigrants | Sweden | 44.3 /100 | #179 | Average 4.9% |
| Asians | 40.8 /100 | #180 | Average 4.9% |
| Hungarians | 40.6 /100 | #181 | Average 4.9% |
Demographics Similar to Slavs by Unemployment Among Ages 60 to 64 years
In terms of unemployment among ages 60 to 64 years, the demographic groups most similar to Slavs are Tongan (4.6%, a difference of 0.010%), Immigrants from Eastern Africa (4.6%, a difference of 0.030%), Croatian (4.6%, a difference of 0.080%), Creek (4.6%, a difference of 0.16%), and Northern European (4.6%, a difference of 0.21%).
| Demographics | Rating | Rank | Unemployment Among Ages 60 to 64 years |
| Immigrants | Middle Africa | 99.7 /100 | #64 | Exceptional 4.6% |
| Jordanians | 99.7 /100 | #65 | Exceptional 4.6% |
| Hawaiians | 99.6 /100 | #66 | Exceptional 4.6% |
| Immigrants | Scotland | 99.6 /100 | #67 | Exceptional 4.6% |
| Immigrants | Laos | 99.6 /100 | #68 | Exceptional 4.6% |
| Creek | 99.6 /100 | #69 | Exceptional 4.6% |
| Croatians | 99.5 /100 | #70 | Exceptional 4.6% |
| Slavs | 99.5 /100 | #71 | Exceptional 4.6% |
| Tongans | 99.5 /100 | #72 | Exceptional 4.6% |
| Immigrants | Eastern Africa | 99.5 /100 | #73 | Exceptional 4.6% |
| Northern Europeans | 99.3 /100 | #74 | Exceptional 4.6% |
| Potawatomi | 99.3 /100 | #75 | Exceptional 4.6% |
| Slovaks | 99.3 /100 | #76 | Exceptional 4.6% |
| Immigrants | Somalia | 99.2 /100 | #77 | Exceptional 4.6% |
| Seminole | 99.2 /100 | #78 | Exceptional 4.7% |