Dutch vs Slavic Unemployment Among Ages 60 to 64 years
COMPARE
Dutch
Slavic
Unemployment Among Ages 60 to 64 years
Unemployment Among Ages 60 to 64 years Comparison
Dutch
Slavs
4.6%
UNEMPLOYMENT AMONG AGES 60 TO 64 YEARS
99.9/ 100
METRIC RATING
54th/ 347
METRIC RANK
4.6%
UNEMPLOYMENT AMONG AGES 60 TO 64 YEARS
99.5/ 100
METRIC RATING
71st/ 347
METRIC RANK
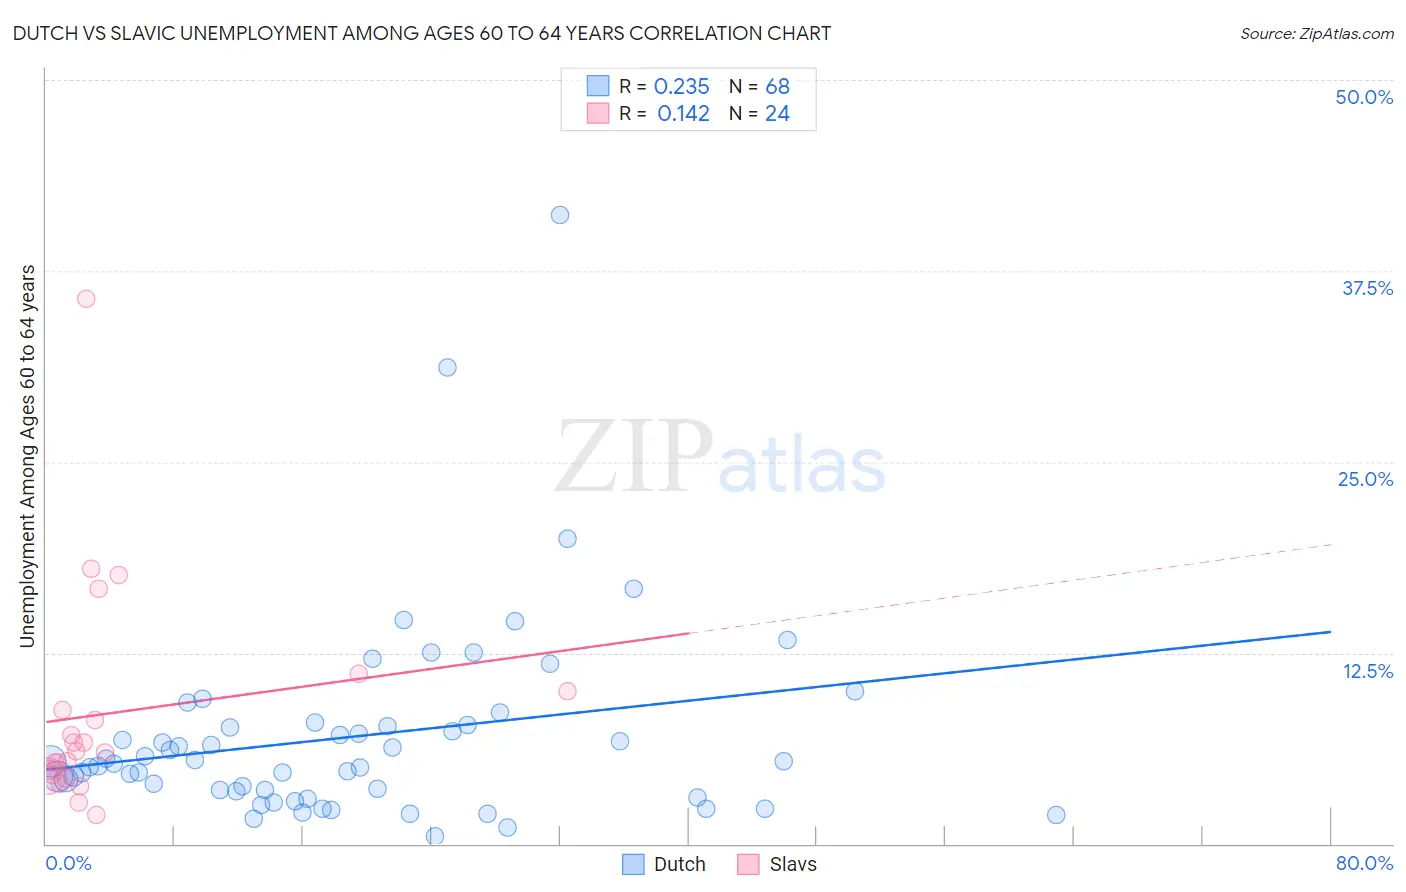
Dutch vs Slavic Unemployment Among Ages 60 to 64 years Correlation Chart
The statistical analysis conducted on geographies consisting of 455,914,011 people shows a weak positive correlation between the proportion of Dutch and unemployment rate among population between the ages 60 and 64 in the United States with a correlation coefficient (R) of 0.235 and weighted average of 4.6%. Similarly, the statistical analysis conducted on geographies consisting of 250,860,466 people shows a poor positive correlation between the proportion of Slavs and unemployment rate among population between the ages 60 and 64 in the United States with a correlation coefficient (R) of 0.142 and weighted average of 4.6%, a difference of 1.3%.
Unemployment Among Ages 60 to 64 years Correlation Summary
| Measurement | Dutch | Slavic |
| Minimum | 0.50% | 1.9% |
| Maximum | 41.1% | 35.7% |
| Range | 40.6% | 33.8% |
| Mean | 7.0% | 8.5% |
| Median | 5.3% | 6.0% |
| Interquartile 25% (IQ1) | 3.5% | 4.4% |
| Interquartile 75% (IQ3) | 7.7% | 9.4% |
| Interquartile Range (IQR) | 4.3% | 4.9% |
| Standard Deviation (Sample) | 6.5% | 7.3% |
| Standard Deviation (Population) | 6.5% | 7.1% |
Demographics Similar to Dutch and Slavs by Unemployment Among Ages 60 to 64 years
In terms of unemployment among ages 60 to 64 years, the demographic groups most similar to Dutch are Bangladeshi (4.6%, a difference of 0.020%), Immigrants from Moldova (4.6%, a difference of 0.030%), Welsh (4.6%, a difference of 0.11%), British (4.6%, a difference of 0.12%), and Kenyan (4.6%, a difference of 0.14%). Similarly, the demographic groups most similar to Slavs are Tongan (4.6%, a difference of 0.010%), Croatian (4.6%, a difference of 0.080%), Creek (4.6%, a difference of 0.16%), Immigrants from Laos (4.6%, a difference of 0.26%), and Immigrants from Scotland (4.6%, a difference of 0.29%).
| Demographics | Rating | Rank | Unemployment Among Ages 60 to 64 years |
| Kenyans | 99.9 /100 | #52 | Exceptional 4.6% |
| Immigrants | Moldova | 99.9 /100 | #53 | Exceptional 4.6% |
| Dutch | 99.9 /100 | #54 | Exceptional 4.6% |
| Bangladeshis | 99.9 /100 | #55 | Exceptional 4.6% |
| Welsh | 99.9 /100 | #56 | Exceptional 4.6% |
| British | 99.9 /100 | #57 | Exceptional 4.6% |
| Immigrants | India | 99.8 /100 | #58 | Exceptional 4.6% |
| Swiss | 99.8 /100 | #59 | Exceptional 4.6% |
| Puget Sound Salish | 99.8 /100 | #60 | Exceptional 4.6% |
| Lebanese | 99.8 /100 | #61 | Exceptional 4.6% |
| Senegalese | 99.7 /100 | #62 | Exceptional 4.6% |
| Czechoslovakians | 99.7 /100 | #63 | Exceptional 4.6% |
| Immigrants | Middle Africa | 99.7 /100 | #64 | Exceptional 4.6% |
| Jordanians | 99.7 /100 | #65 | Exceptional 4.6% |
| Hawaiians | 99.6 /100 | #66 | Exceptional 4.6% |
| Immigrants | Scotland | 99.6 /100 | #67 | Exceptional 4.6% |
| Immigrants | Laos | 99.6 /100 | #68 | Exceptional 4.6% |
| Creek | 99.6 /100 | #69 | Exceptional 4.6% |
| Croatians | 99.5 /100 | #70 | Exceptional 4.6% |
| Slavs | 99.5 /100 | #71 | Exceptional 4.6% |
| Tongans | 99.5 /100 | #72 | Exceptional 4.6% |