Immigrants from Western Europe vs Hungarian Male Unemployment
COMPARE
Immigrants from Western Europe
Hungarian
Male Unemployment
Male Unemployment Comparison
Immigrants from Western Europe
Hungarians
5.2%
MALE UNEMPLOYMENT
84.8/ 100
METRIC RATING
129th/ 347
METRIC RANK
5.2%
MALE UNEMPLOYMENT
85.1/ 100
METRIC RATING
128th/ 347
METRIC RANK
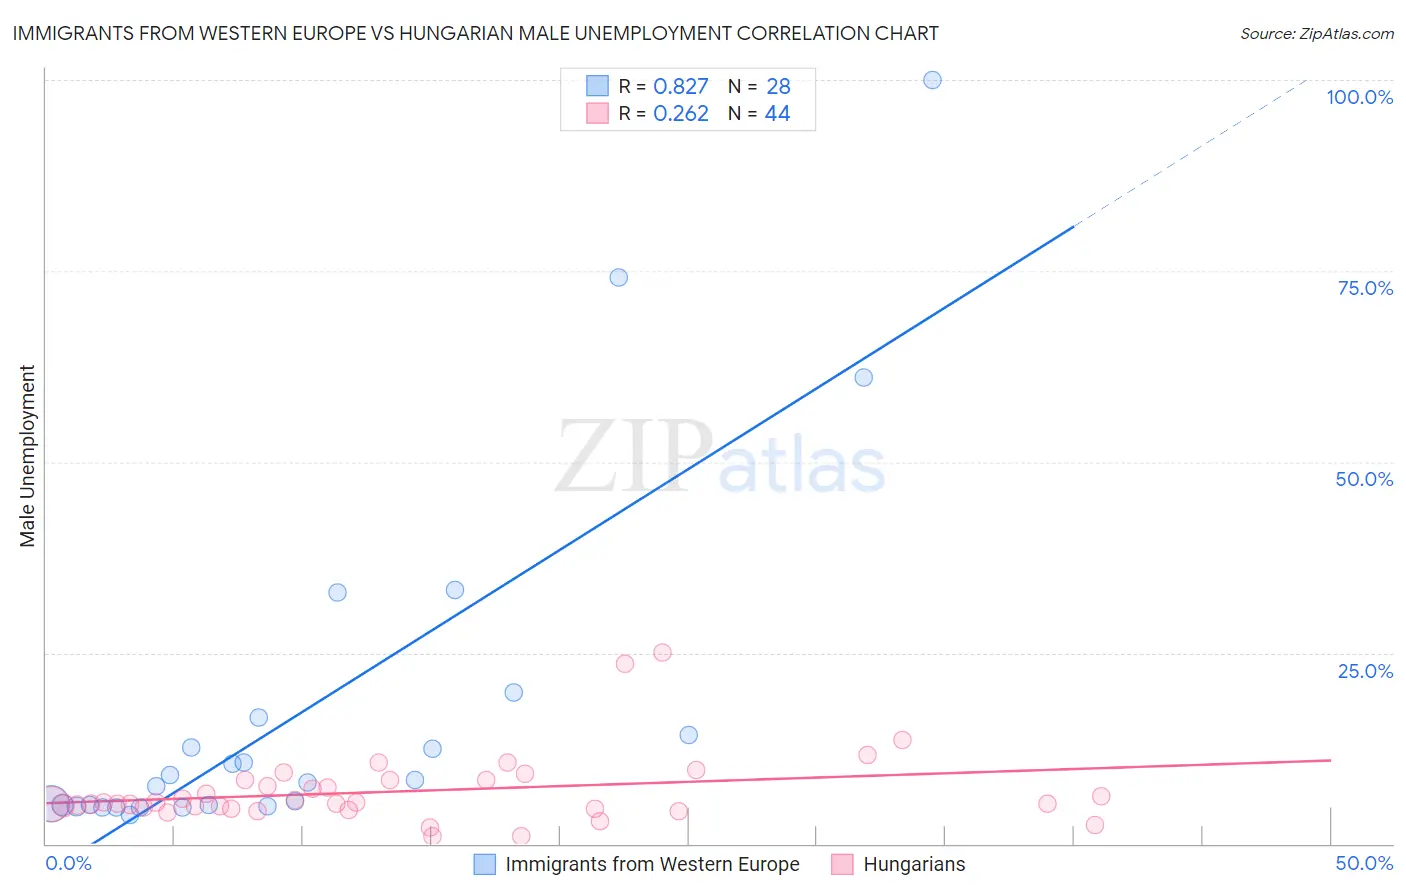
Immigrants from Western Europe vs Hungarian Male Unemployment Correlation Chart
The statistical analysis conducted on geographies consisting of 490,157,705 people shows a very strong positive correlation between the proportion of Immigrants from Western Europe and unemployment rate among males in the United States with a correlation coefficient (R) of 0.827 and weighted average of 5.2%. Similarly, the statistical analysis conducted on geographies consisting of 482,025,300 people shows a weak positive correlation between the proportion of Hungarians and unemployment rate among males in the United States with a correlation coefficient (R) of 0.262 and weighted average of 5.2%, a difference of 0.030%.
Male Unemployment Correlation Summary
| Measurement | Immigrants from Western Europe | Hungarian |
| Minimum | 3.8% | 0.92% |
| Maximum | 100.0% | 25.0% |
| Range | 96.2% | 24.1% |
| Mean | 17.5% | 6.9% |
| Median | 8.2% | 5.3% |
| Interquartile 25% (IQ1) | 4.9% | 4.7% |
| Interquartile 75% (IQ3) | 15.4% | 8.3% |
| Interquartile Range (IQR) | 10.4% | 3.6% |
| Standard Deviation (Sample) | 23.4% | 4.7% |
| Standard Deviation (Population) | 23.0% | 4.6% |
Demographics Similar to Immigrants from Western Europe and Hungarians by Male Unemployment
In terms of male unemployment, the demographic groups most similar to Immigrants from Western Europe are Immigrants from Malaysia (5.2%, a difference of 0.15%), Immigrants from Brazil (5.2%, a difference of 0.18%), Immigrants from Germany (5.2%, a difference of 0.20%), Chickasaw (5.2%, a difference of 0.21%), and Immigrants from Colombia (5.1%, a difference of 0.24%). Similarly, the demographic groups most similar to Hungarians are Immigrants from Brazil (5.2%, a difference of 0.15%), Immigrants from Malaysia (5.2%, a difference of 0.18%), Immigrants from Colombia (5.1%, a difference of 0.21%), Immigrants from Germany (5.2%, a difference of 0.23%), and Chickasaw (5.2%, a difference of 0.25%).
| Demographics | Rating | Rank | Male Unemployment |
| Cypriots | 88.8 /100 | #118 | Excellent 5.1% |
| French Canadians | 88.6 /100 | #119 | Excellent 5.1% |
| Ukrainians | 88.4 /100 | #120 | Excellent 5.1% |
| Mongolians | 88.4 /100 | #121 | Excellent 5.1% |
| Nicaraguans | 88.2 /100 | #122 | Excellent 5.1% |
| Palestinians | 87.7 /100 | #123 | Excellent 5.1% |
| Immigrants | Latvia | 87.5 /100 | #124 | Excellent 5.1% |
| Immigrants | Lithuania | 87.2 /100 | #125 | Excellent 5.1% |
| Immigrants | Colombia | 86.8 /100 | #126 | Excellent 5.1% |
| Immigrants | Brazil | 86.3 /100 | #127 | Excellent 5.2% |
| Hungarians | 85.1 /100 | #128 | Excellent 5.2% |
| Immigrants | Western Europe | 84.8 /100 | #129 | Excellent 5.2% |
| Immigrants | Malaysia | 83.5 /100 | #130 | Excellent 5.2% |
| Immigrants | Germany | 83.0 /100 | #131 | Excellent 5.2% |
| Chickasaw | 82.9 /100 | #132 | Excellent 5.2% |
| Colombians | 81.1 /100 | #133 | Excellent 5.2% |
| Pakistanis | 80.5 /100 | #134 | Excellent 5.2% |
| Immigrants | Saudi Arabia | 80.1 /100 | #135 | Excellent 5.2% |
| Lebanese | 79.9 /100 | #136 | Good 5.2% |
| Immigrants | Eastern Africa | 79.8 /100 | #137 | Good 5.2% |
| Immigrants | Croatia | 79.7 /100 | #138 | Good 5.2% |