Immigrants from Uzbekistan vs Panamanian Female Unemployment
COMPARE
Immigrants from Uzbekistan
Panamanian
Female Unemployment
Female Unemployment Comparison
Immigrants from Uzbekistan
Panamanians
5.6%
FEMALE UNEMPLOYMENT
1.0/ 100
METRIC RATING
249th/ 347
METRIC RANK
5.5%
FEMALE UNEMPLOYMENT
4.7/ 100
METRIC RATING
229th/ 347
METRIC RANK
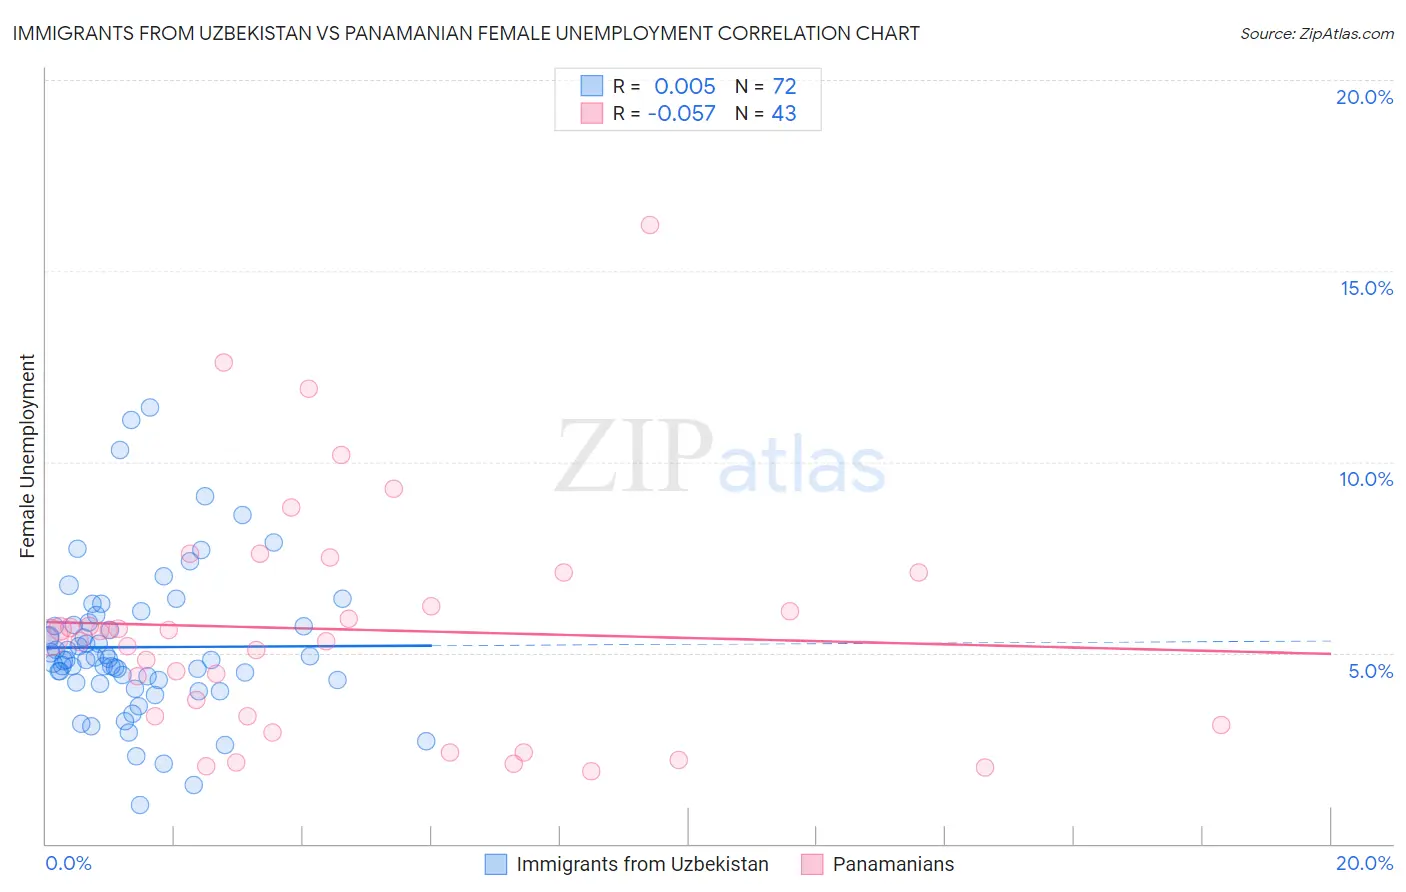
Immigrants from Uzbekistan vs Panamanian Female Unemployment Correlation Chart
The statistical analysis conducted on geographies consisting of 118,629,225 people shows no correlation between the proportion of Immigrants from Uzbekistan and unemploymnet rate among females in the United States with a correlation coefficient (R) of 0.005 and weighted average of 5.6%. Similarly, the statistical analysis conducted on geographies consisting of 280,650,516 people shows a slight negative correlation between the proportion of Panamanians and unemploymnet rate among females in the United States with a correlation coefficient (R) of -0.057 and weighted average of 5.5%, a difference of 2.3%.
Female Unemployment Correlation Summary
| Measurement | Immigrants from Uzbekistan | Panamanian |
| Minimum | 1.0% | 1.9% |
| Maximum | 11.4% | 16.2% |
| Range | 10.4% | 14.3% |
| Mean | 5.1% | 5.6% |
| Median | 4.8% | 5.4% |
| Interquartile 25% (IQ1) | 4.3% | 3.3% |
| Interquartile 75% (IQ3) | 5.8% | 7.1% |
| Interquartile Range (IQR) | 1.5% | 3.8% |
| Standard Deviation (Sample) | 1.9% | 3.1% |
| Standard Deviation (Population) | 1.9% | 3.0% |
Demographics Similar to Immigrants from Uzbekistan and Panamanians by Female Unemployment
In terms of female unemployment, the demographic groups most similar to Immigrants from Uzbekistan are Cree (5.6%, a difference of 0.040%), Immigrants from Western Asia (5.6%, a difference of 0.20%), Japanese (5.6%, a difference of 0.28%), Guamanian/Chamorro (5.6%, a difference of 0.51%), and Immigrants from Liberia (5.6%, a difference of 0.65%). Similarly, the demographic groups most similar to Panamanians are Immigrants from Uruguay (5.5%, a difference of 0.010%), Immigrants from Iraq (5.5%, a difference of 0.28%), Liberian (5.5%, a difference of 0.29%), Moroccan (5.5%, a difference of 0.50%), and Immigrants from Lebanon (5.5%, a difference of 0.52%).
| Demographics | Rating | Rank | Female Unemployment |
| Panamanians | 4.7 /100 | #229 | Tragic 5.5% |
| Immigrants | Uruguay | 4.7 /100 | #230 | Tragic 5.5% |
| Immigrants | Iraq | 3.9 /100 | #231 | Tragic 5.5% |
| Liberians | 3.9 /100 | #232 | Tragic 5.5% |
| Moroccans | 3.4 /100 | #233 | Tragic 5.5% |
| Immigrants | Lebanon | 3.3 /100 | #234 | Tragic 5.5% |
| Immigrants | Iran | 3.3 /100 | #235 | Tragic 5.5% |
| Immigrants | Cambodia | 3.3 /100 | #236 | Tragic 5.5% |
| Immigrants | Panama | 3.2 /100 | #237 | Tragic 5.5% |
| Sierra Leoneans | 3.2 /100 | #238 | Tragic 5.5% |
| Aleuts | 3.0 /100 | #239 | Tragic 5.5% |
| Immigrants | South America | 2.9 /100 | #240 | Tragic 5.5% |
| South American Indians | 2.8 /100 | #241 | Tragic 5.5% |
| Marshallese | 2.3 /100 | #242 | Tragic 5.6% |
| Spanish Americans | 2.2 /100 | #243 | Tragic 5.6% |
| Immigrants | Liberia | 1.5 /100 | #244 | Tragic 5.6% |
| Guamanians/Chamorros | 1.4 /100 | #245 | Tragic 5.6% |
| Japanese | 1.2 /100 | #246 | Tragic 5.6% |
| Immigrants | Western Asia | 1.1 /100 | #247 | Tragic 5.6% |
| Cree | 1.0 /100 | #248 | Tragic 5.6% |
| Immigrants | Uzbekistan | 1.0 /100 | #249 | Tragic 5.6% |