Immigrants from Uzbekistan vs Immigrants from Bahamas Female Unemployment
COMPARE
Immigrants from Uzbekistan
Immigrants from Bahamas
Female Unemployment
Female Unemployment Comparison
Immigrants from Uzbekistan
Immigrants from Bahamas
5.6%
FEMALE UNEMPLOYMENT
1.0/ 100
METRIC RATING
249th/ 347
METRIC RANK
5.8%
FEMALE UNEMPLOYMENT
0.1/ 100
METRIC RATING
264th/ 347
METRIC RANK
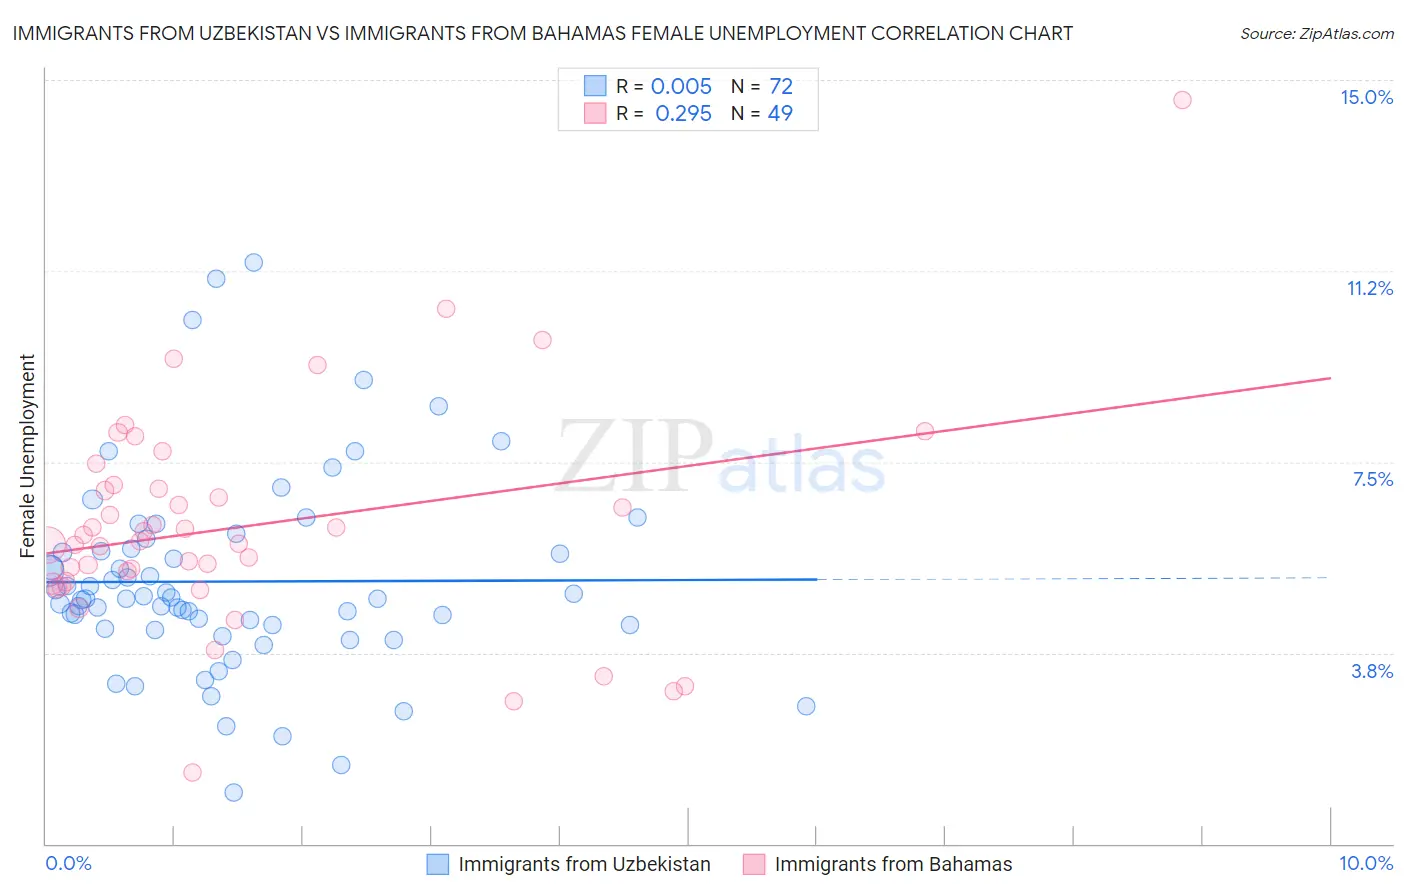
Immigrants from Uzbekistan vs Immigrants from Bahamas Female Unemployment Correlation Chart
The statistical analysis conducted on geographies consisting of 118,629,225 people shows no correlation between the proportion of Immigrants from Uzbekistan and unemploymnet rate among females in the United States with a correlation coefficient (R) of 0.005 and weighted average of 5.6%. Similarly, the statistical analysis conducted on geographies consisting of 104,550,633 people shows a weak positive correlation between the proportion of Immigrants from Bahamas and unemploymnet rate among females in the United States with a correlation coefficient (R) of 0.295 and weighted average of 5.8%, a difference of 3.8%.
Female Unemployment Correlation Summary
| Measurement | Immigrants from Uzbekistan | Immigrants from Bahamas |
| Minimum | 1.0% | 1.4% |
| Maximum | 11.4% | 14.6% |
| Range | 10.4% | 13.2% |
| Mean | 5.1% | 6.2% |
| Median | 4.8% | 5.9% |
| Interquartile 25% (IQ1) | 4.3% | 5.1% |
| Interquartile 75% (IQ3) | 5.8% | 7.0% |
| Interquartile Range (IQR) | 1.5% | 1.9% |
| Standard Deviation (Sample) | 1.9% | 2.2% |
| Standard Deviation (Population) | 1.9% | 2.2% |
Demographics Similar to Immigrants from Uzbekistan and Immigrants from Bahamas by Female Unemployment
In terms of female unemployment, the demographic groups most similar to Immigrants from Uzbekistan are Cree (5.6%, a difference of 0.040%), Immigrants from Western Asia (5.6%, a difference of 0.20%), Japanese (5.6%, a difference of 0.28%), Immigrants from Syria (5.6%, a difference of 0.29%), and Assyrian/Chaldean/Syriac (5.6%, a difference of 0.35%). Similarly, the demographic groups most similar to Immigrants from Bahamas are Immigrants from the Azores (5.8%, a difference of 0.39%), Blackfeet (5.9%, a difference of 0.40%), Cape Verdean (5.9%, a difference of 0.68%), Immigrants from Nigeria (5.8%, a difference of 1.1%), and Kiowa (5.8%, a difference of 1.1%).
| Demographics | Rating | Rank | Female Unemployment |
| Japanese | 1.2 /100 | #246 | Tragic 5.6% |
| Immigrants | Western Asia | 1.1 /100 | #247 | Tragic 5.6% |
| Cree | 1.0 /100 | #248 | Tragic 5.6% |
| Immigrants | Uzbekistan | 1.0 /100 | #249 | Tragic 5.6% |
| Immigrants | Syria | 0.8 /100 | #250 | Tragic 5.6% |
| Assyrians/Chaldeans/Syriacs | 0.8 /100 | #251 | Tragic 5.6% |
| Cajuns | 0.7 /100 | #252 | Tragic 5.7% |
| Immigrants | Sierra Leone | 0.6 /100 | #253 | Tragic 5.7% |
| Immigrants | Immigrants | 0.6 /100 | #254 | Tragic 5.7% |
| Immigrants | Cameroon | 0.6 /100 | #255 | Tragic 5.7% |
| Sub-Saharan Africans | 0.4 /100 | #256 | Tragic 5.7% |
| Dutch West Indians | 0.3 /100 | #257 | Tragic 5.7% |
| Immigrants | Portugal | 0.2 /100 | #258 | Tragic 5.8% |
| Immigrants | Fiji | 0.2 /100 | #259 | Tragic 5.8% |
| Nigerians | 0.2 /100 | #260 | Tragic 5.8% |
| Kiowa | 0.1 /100 | #261 | Tragic 5.8% |
| Immigrants | Nigeria | 0.1 /100 | #262 | Tragic 5.8% |
| Immigrants | Azores | 0.1 /100 | #263 | Tragic 5.8% |
| Immigrants | Bahamas | 0.1 /100 | #264 | Tragic 5.8% |
| Blackfeet | 0.0 /100 | #265 | Tragic 5.9% |
| Cape Verdeans | 0.0 /100 | #266 | Tragic 5.9% |