Samoan vs Panamanian Female Unemployment
COMPARE
Samoan
Panamanian
Female Unemployment
Female Unemployment Comparison
Samoans
Panamanians
5.4%
FEMALE UNEMPLOYMENT
10.6/ 100
METRIC RATING
213th/ 347
METRIC RANK
5.5%
FEMALE UNEMPLOYMENT
4.7/ 100
METRIC RATING
229th/ 347
METRIC RANK
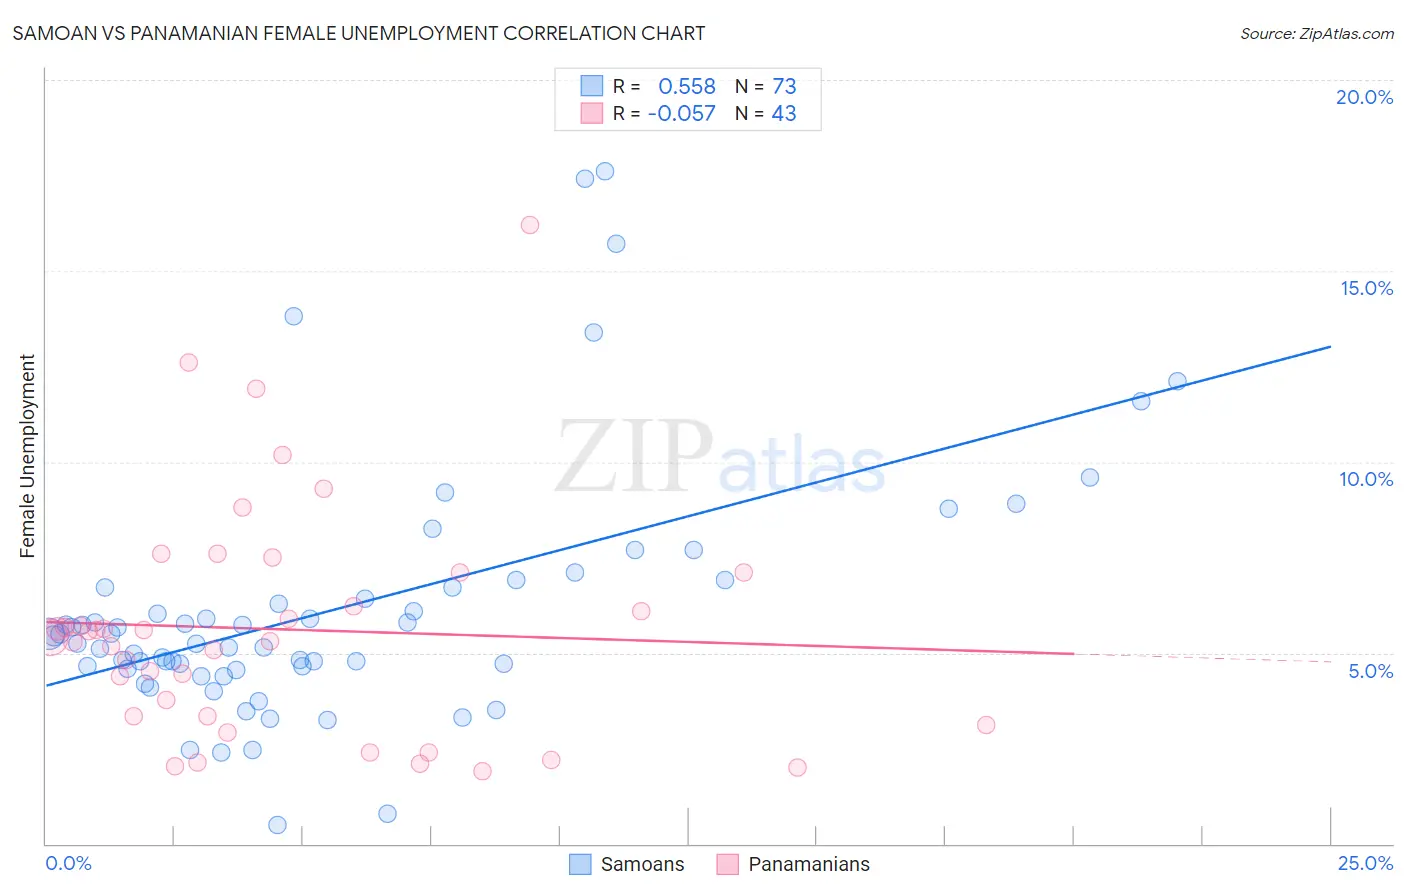
Samoan vs Panamanian Female Unemployment Correlation Chart
The statistical analysis conducted on geographies consisting of 224,572,142 people shows a substantial positive correlation between the proportion of Samoans and unemploymnet rate among females in the United States with a correlation coefficient (R) of 0.558 and weighted average of 5.4%. Similarly, the statistical analysis conducted on geographies consisting of 280,650,516 people shows a slight negative correlation between the proportion of Panamanians and unemploymnet rate among females in the United States with a correlation coefficient (R) of -0.057 and weighted average of 5.5%, a difference of 1.3%.
Female Unemployment Correlation Summary
| Measurement | Samoan | Panamanian |
| Minimum | 0.50% | 1.9% |
| Maximum | 17.6% | 16.2% |
| Range | 17.1% | 14.3% |
| Mean | 6.1% | 5.6% |
| Median | 5.4% | 5.4% |
| Interquartile 25% (IQ1) | 4.6% | 3.3% |
| Interquartile 75% (IQ3) | 6.7% | 7.1% |
| Interquartile Range (IQR) | 2.1% | 3.8% |
| Standard Deviation (Sample) | 3.3% | 3.1% |
| Standard Deviation (Population) | 3.3% | 3.0% |
Demographics Similar to Samoans and Panamanians by Female Unemployment
In terms of female unemployment, the demographic groups most similar to Samoans are Seminole (5.4%, a difference of 0.050%), Immigrants from Nicaragua (5.4%, a difference of 0.070%), Comanche (5.4%, a difference of 0.090%), Uruguayan (5.4%, a difference of 0.12%), and Ottawa (5.4%, a difference of 0.14%). Similarly, the demographic groups most similar to Panamanians are Israeli (5.5%, a difference of 0.010%), Immigrants from Uruguay (5.5%, a difference of 0.010%), Immigrants from Philippines (5.5%, a difference of 0.17%), Immigrants from Iraq (5.5%, a difference of 0.28%), and Immigrants from Peru (5.5%, a difference of 0.34%).
| Demographics | Rating | Rank | Female Unemployment |
| Ottawa | 11.6 /100 | #211 | Poor 5.4% |
| Uruguayans | 11.4 /100 | #212 | Poor 5.4% |
| Samoans | 10.6 /100 | #213 | Poor 5.4% |
| Seminole | 10.3 /100 | #214 | Poor 5.4% |
| Immigrants | Nicaragua | 10.2 /100 | #215 | Poor 5.4% |
| Comanche | 10.0 /100 | #216 | Poor 5.4% |
| Peruvians | 9.6 /100 | #217 | Tragic 5.4% |
| Bermudans | 9.0 /100 | #218 | Tragic 5.4% |
| South Americans | 8.6 /100 | #219 | Tragic 5.4% |
| Immigrants | Africa | 8.5 /100 | #220 | Tragic 5.4% |
| Brazilians | 7.3 /100 | #221 | Tragic 5.5% |
| Nicaraguans | 7.2 /100 | #222 | Tragic 5.5% |
| Delaware | 7.2 /100 | #223 | Tragic 5.5% |
| Iraqis | 7.1 /100 | #224 | Tragic 5.5% |
| French American Indians | 6.1 /100 | #225 | Tragic 5.5% |
| Immigrants | Peru | 5.9 /100 | #226 | Tragic 5.5% |
| Immigrants | Philippines | 5.3 /100 | #227 | Tragic 5.5% |
| Israelis | 4.8 /100 | #228 | Tragic 5.5% |
| Panamanians | 4.7 /100 | #229 | Tragic 5.5% |
| Immigrants | Uruguay | 4.7 /100 | #230 | Tragic 5.5% |
| Immigrants | Iraq | 3.9 /100 | #231 | Tragic 5.5% |