Immigrants from Uzbekistan vs Immigrants from Central America Female Unemployment
COMPARE
Immigrants from Uzbekistan
Immigrants from Central America
Female Unemployment
Female Unemployment Comparison
Immigrants from Uzbekistan
Immigrants from Central America
5.6%
FEMALE UNEMPLOYMENT
1.0/ 100
METRIC RATING
249th/ 347
METRIC RANK
6.2%
FEMALE UNEMPLOYMENT
0.0/ 100
METRIC RATING
306th/ 347
METRIC RANK
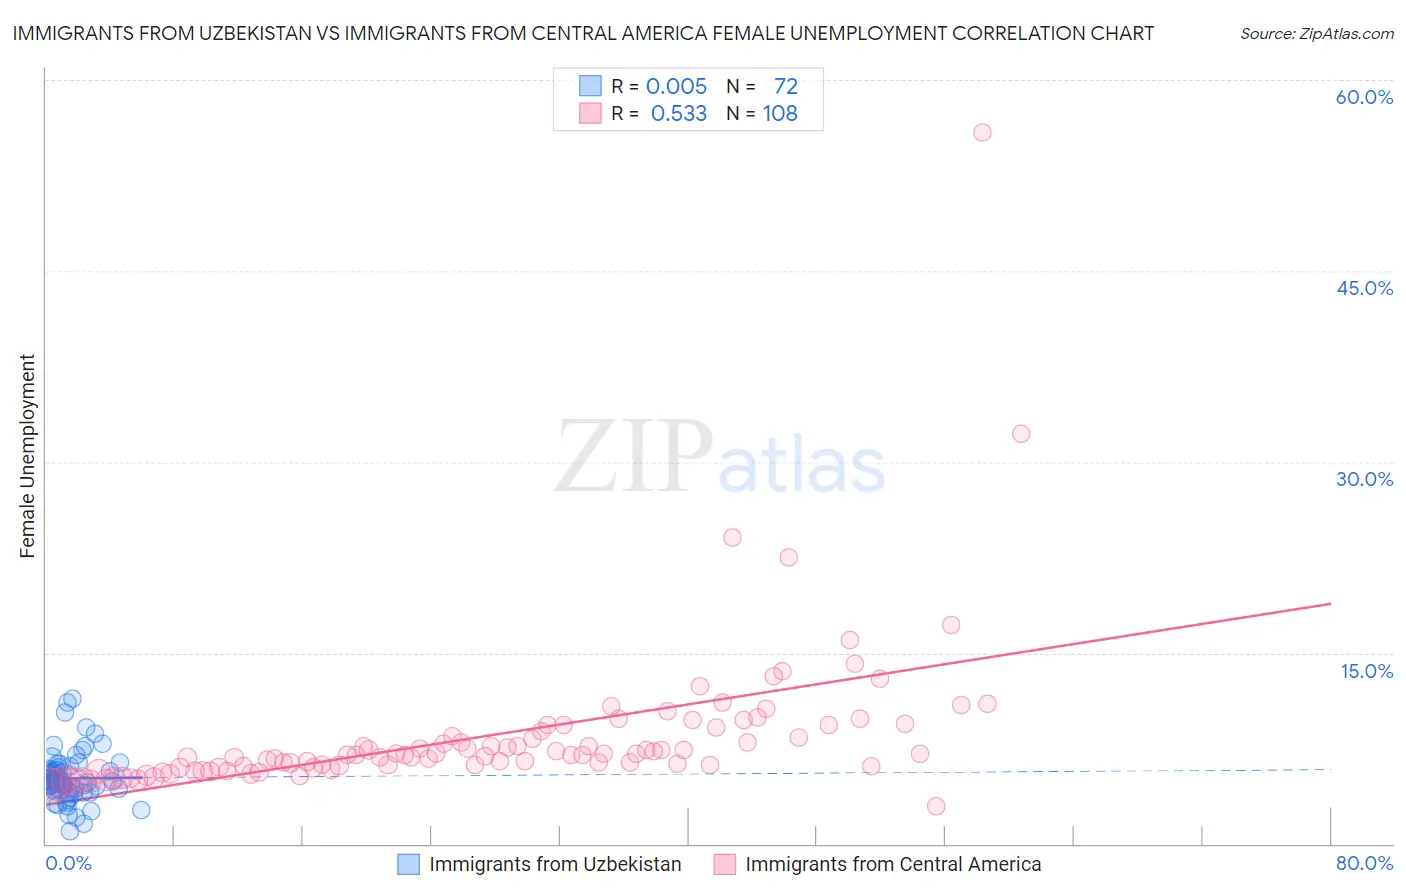
Immigrants from Uzbekistan vs Immigrants from Central America Female Unemployment Correlation Chart
The statistical analysis conducted on geographies consisting of 118,629,225 people shows no correlation between the proportion of Immigrants from Uzbekistan and unemploymnet rate among females in the United States with a correlation coefficient (R) of 0.005 and weighted average of 5.6%. Similarly, the statistical analysis conducted on geographies consisting of 528,420,242 people shows a substantial positive correlation between the proportion of Immigrants from Central America and unemploymnet rate among females in the United States with a correlation coefficient (R) of 0.533 and weighted average of 6.2%, a difference of 10.7%.
Female Unemployment Correlation Summary
| Measurement | Immigrants from Uzbekistan | Immigrants from Central America |
| Minimum | 1.0% | 2.9% |
| Maximum | 11.4% | 55.9% |
| Range | 10.4% | 53.0% |
| Mean | 5.1% | 8.5% |
| Median | 4.8% | 7.0% |
| Interquartile 25% (IQ1) | 4.3% | 6.0% |
| Interquartile 75% (IQ3) | 5.8% | 9.0% |
| Interquartile Range (IQR) | 1.5% | 3.0% |
| Standard Deviation (Sample) | 1.9% | 6.1% |
| Standard Deviation (Population) | 1.9% | 6.1% |
Similar Demographics by Female Unemployment
Demographics Similar to Immigrants from Uzbekistan by Female Unemployment
In terms of female unemployment, the demographic groups most similar to Immigrants from Uzbekistan are Cree (5.6%, a difference of 0.040%), Immigrants from Western Asia (5.6%, a difference of 0.20%), Japanese (5.6%, a difference of 0.28%), Immigrants from Syria (5.6%, a difference of 0.29%), and Assyrian/Chaldean/Syriac (5.6%, a difference of 0.35%).
| Demographics | Rating | Rank | Female Unemployment |
| Marshallese | 2.3 /100 | #242 | Tragic 5.6% |
| Spanish Americans | 2.2 /100 | #243 | Tragic 5.6% |
| Immigrants | Liberia | 1.5 /100 | #244 | Tragic 5.6% |
| Guamanians/Chamorros | 1.4 /100 | #245 | Tragic 5.6% |
| Japanese | 1.2 /100 | #246 | Tragic 5.6% |
| Immigrants | Western Asia | 1.1 /100 | #247 | Tragic 5.6% |
| Cree | 1.0 /100 | #248 | Tragic 5.6% |
| Immigrants | Uzbekistan | 1.0 /100 | #249 | Tragic 5.6% |
| Immigrants | Syria | 0.8 /100 | #250 | Tragic 5.6% |
| Assyrians/Chaldeans/Syriacs | 0.8 /100 | #251 | Tragic 5.6% |
| Cajuns | 0.7 /100 | #252 | Tragic 5.7% |
| Immigrants | Sierra Leone | 0.6 /100 | #253 | Tragic 5.7% |
| Immigrants | Immigrants | 0.6 /100 | #254 | Tragic 5.7% |
| Immigrants | Cameroon | 0.6 /100 | #255 | Tragic 5.7% |
| Sub-Saharan Africans | 0.4 /100 | #256 | Tragic 5.7% |
Demographics Similar to Immigrants from Central America by Female Unemployment
In terms of female unemployment, the demographic groups most similar to Immigrants from Central America are Shoshone (6.2%, a difference of 0.010%), Hispanic or Latino (6.2%, a difference of 0.070%), Spanish American Indian (6.2%, a difference of 0.16%), Immigrants from Jamaica (6.2%, a difference of 0.21%), and Barbadian (6.2%, a difference of 0.58%).
| Demographics | Rating | Rank | Female Unemployment |
| Ute | 0.0 /100 | #299 | Tragic 6.1% |
| Immigrants | Haiti | 0.0 /100 | #300 | Tragic 6.1% |
| Immigrants | Barbados | 0.0 /100 | #301 | Tragic 6.2% |
| U.S. Virgin Islanders | 0.0 /100 | #302 | Tragic 6.2% |
| Barbadians | 0.0 /100 | #303 | Tragic 6.2% |
| Immigrants | Jamaica | 0.0 /100 | #304 | Tragic 6.2% |
| Spanish American Indians | 0.0 /100 | #305 | Tragic 6.2% |
| Immigrants | Central America | 0.0 /100 | #306 | Tragic 6.2% |
| Shoshone | 0.0 /100 | #307 | Tragic 6.2% |
| Hispanics or Latinos | 0.0 /100 | #308 | Tragic 6.2% |
| Ecuadorians | 0.0 /100 | #309 | Tragic 6.3% |
| Central American Indians | 0.0 /100 | #310 | Tragic 6.3% |
| Immigrants | Mexico | 0.0 /100 | #311 | Tragic 6.3% |
| Immigrants | Grenada | 0.0 /100 | #312 | Tragic 6.3% |
| Belizeans | 0.0 /100 | #313 | Tragic 6.3% |