Fijian vs Panamanian Female Unemployment
COMPARE
Fijian
Panamanian
Female Unemployment
Female Unemployment Comparison
Fijians
Panamanians
4.7%
FEMALE UNEMPLOYMENT
99.9/ 100
METRIC RATING
21st/ 347
METRIC RANK
5.5%
FEMALE UNEMPLOYMENT
4.7/ 100
METRIC RATING
229th/ 347
METRIC RANK
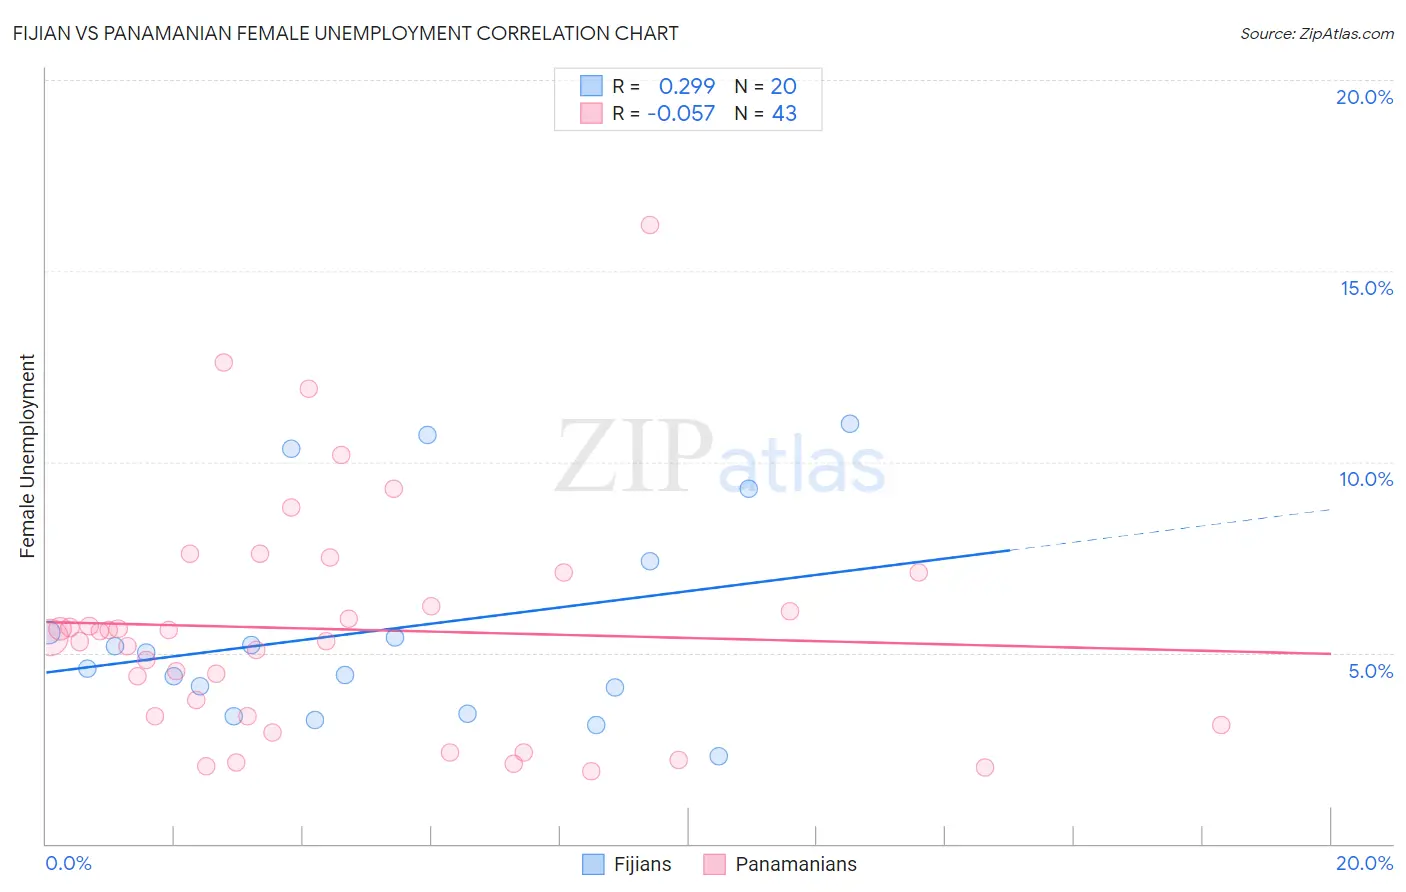
Fijian vs Panamanian Female Unemployment Correlation Chart
The statistical analysis conducted on geographies consisting of 55,900,022 people shows a weak positive correlation between the proportion of Fijians and unemploymnet rate among females in the United States with a correlation coefficient (R) of 0.299 and weighted average of 4.7%. Similarly, the statistical analysis conducted on geographies consisting of 280,650,516 people shows a slight negative correlation between the proportion of Panamanians and unemploymnet rate among females in the United States with a correlation coefficient (R) of -0.057 and weighted average of 5.5%, a difference of 17.2%.
Female Unemployment Correlation Summary
| Measurement | Fijian | Panamanian |
| Minimum | 2.3% | 1.9% |
| Maximum | 11.0% | 16.2% |
| Range | 8.7% | 14.3% |
| Mean | 5.6% | 5.6% |
| Median | 4.8% | 5.4% |
| Interquartile 25% (IQ1) | 3.7% | 3.3% |
| Interquartile 75% (IQ3) | 6.5% | 7.1% |
| Interquartile Range (IQR) | 2.7% | 3.8% |
| Standard Deviation (Sample) | 2.7% | 3.1% |
| Standard Deviation (Population) | 2.6% | 3.0% |
Similar Demographics by Female Unemployment
Demographics Similar to Fijians by Female Unemployment
In terms of female unemployment, the demographic groups most similar to Fijians are Bulgarian (4.7%, a difference of 0.010%), European (4.7%, a difference of 0.020%), Polish (4.7%, a difference of 0.090%), Latvian (4.7%, a difference of 0.10%), and Croatian (4.7%, a difference of 0.25%).
| Demographics | Rating | Rank | Female Unemployment |
| Finns | 100.0 /100 | #14 | Exceptional 4.6% |
| English | 100.0 /100 | #15 | Exceptional 4.6% |
| Carpatho Rusyns | 99.9 /100 | #16 | Exceptional 4.7% |
| Croatians | 99.9 /100 | #17 | Exceptional 4.7% |
| Latvians | 99.9 /100 | #18 | Exceptional 4.7% |
| Poles | 99.9 /100 | #19 | Exceptional 4.7% |
| Bulgarians | 99.9 /100 | #20 | Exceptional 4.7% |
| Fijians | 99.9 /100 | #21 | Exceptional 4.7% |
| Europeans | 99.9 /100 | #22 | Exceptional 4.7% |
| Scottish | 99.9 /100 | #23 | Exceptional 4.7% |
| Welsh | 99.9 /100 | #24 | Exceptional 4.7% |
| Immigrants | India | 99.9 /100 | #25 | Exceptional 4.7% |
| Immigrants | Bosnia and Herzegovina | 99.9 /100 | #26 | Exceptional 4.7% |
| British | 99.9 /100 | #27 | Exceptional 4.7% |
| Irish | 99.9 /100 | #28 | Exceptional 4.7% |
Demographics Similar to Panamanians by Female Unemployment
In terms of female unemployment, the demographic groups most similar to Panamanians are Israeli (5.5%, a difference of 0.010%), Immigrants from Uruguay (5.5%, a difference of 0.010%), Immigrants from Philippines (5.5%, a difference of 0.17%), Immigrants from Iraq (5.5%, a difference of 0.28%), and Liberian (5.5%, a difference of 0.29%).
| Demographics | Rating | Rank | Female Unemployment |
| Nicaraguans | 7.2 /100 | #222 | Tragic 5.5% |
| Delaware | 7.2 /100 | #223 | Tragic 5.5% |
| Iraqis | 7.1 /100 | #224 | Tragic 5.5% |
| French American Indians | 6.1 /100 | #225 | Tragic 5.5% |
| Immigrants | Peru | 5.9 /100 | #226 | Tragic 5.5% |
| Immigrants | Philippines | 5.3 /100 | #227 | Tragic 5.5% |
| Israelis | 4.8 /100 | #228 | Tragic 5.5% |
| Panamanians | 4.7 /100 | #229 | Tragic 5.5% |
| Immigrants | Uruguay | 4.7 /100 | #230 | Tragic 5.5% |
| Immigrants | Iraq | 3.9 /100 | #231 | Tragic 5.5% |
| Liberians | 3.9 /100 | #232 | Tragic 5.5% |
| Moroccans | 3.4 /100 | #233 | Tragic 5.5% |
| Immigrants | Lebanon | 3.3 /100 | #234 | Tragic 5.5% |
| Immigrants | Iran | 3.3 /100 | #235 | Tragic 5.5% |
| Immigrants | Cambodia | 3.3 /100 | #236 | Tragic 5.5% |