Immigrants from Uzbekistan vs Ottawa Unemployment Among Ages 45 to 54 years
COMPARE
Immigrants from Uzbekistan
Ottawa
Unemployment Among Ages 45 to 54 years
Unemployment Among Ages 45 to 54 years Comparison
Immigrants from Uzbekistan
Ottawa
4.9%
UNEMPLOYMENT AMONG AGES 45 TO 54 YEARS
0.0/ 100
METRIC RATING
268th/ 347
METRIC RANK
4.7%
UNEMPLOYMENT AMONG AGES 45 TO 54 YEARS
2.7/ 100
METRIC RATING
232nd/ 347
METRIC RANK
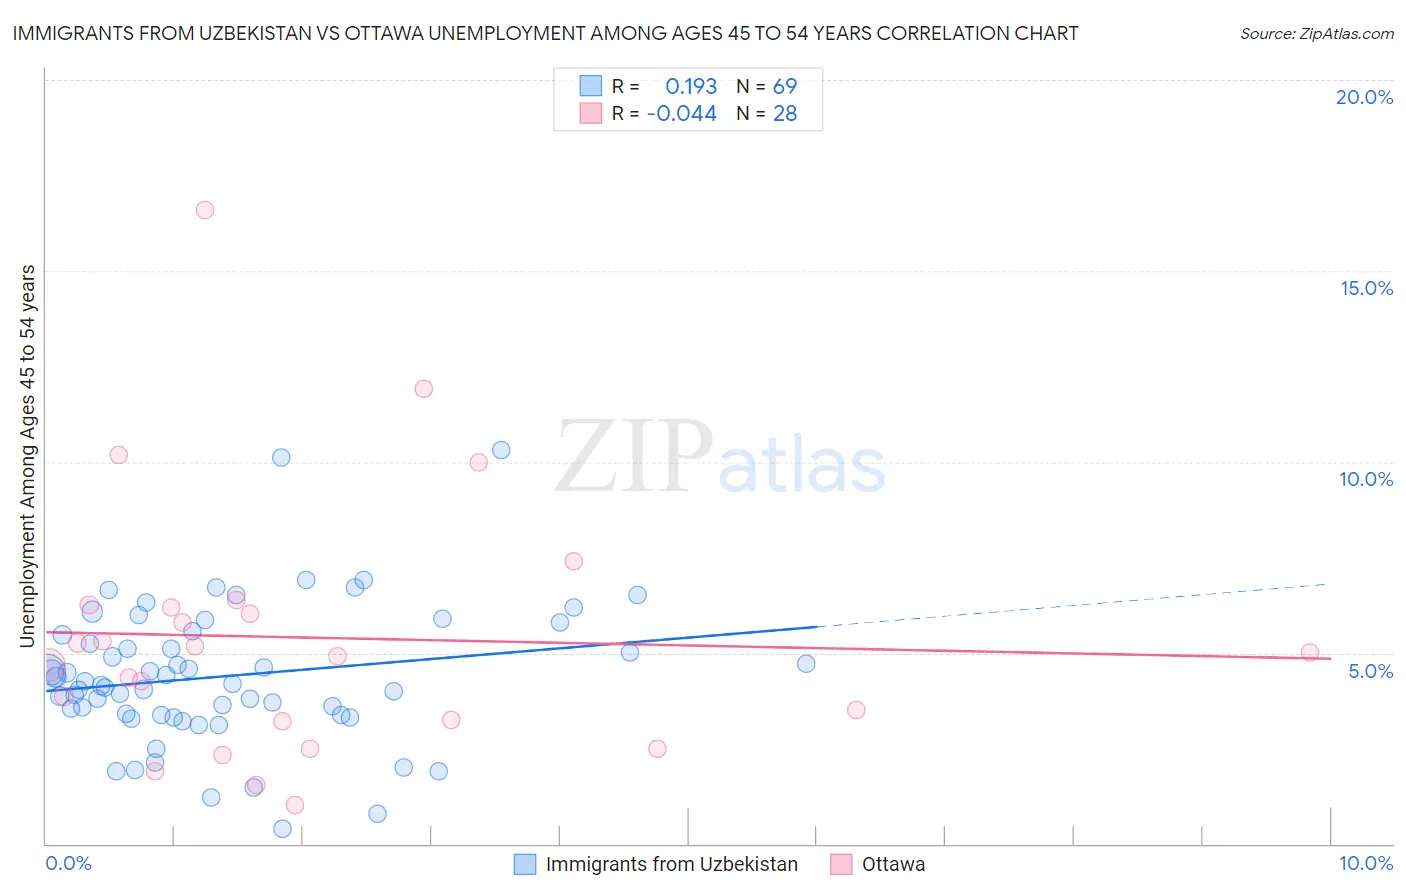
Immigrants from Uzbekistan vs Ottawa Unemployment Among Ages 45 to 54 years Correlation Chart
The statistical analysis conducted on geographies consisting of 117,964,969 people shows a poor positive correlation between the proportion of Immigrants from Uzbekistan and unemployment rate among population between the ages 45 and 54 in the United States with a correlation coefficient (R) of 0.193 and weighted average of 4.9%. Similarly, the statistical analysis conducted on geographies consisting of 49,375,752 people shows no correlation between the proportion of Ottawa and unemployment rate among population between the ages 45 and 54 in the United States with a correlation coefficient (R) of -0.044 and weighted average of 4.7%, a difference of 4.8%.
Unemployment Among Ages 45 to 54 years Correlation Summary
| Measurement | Immigrants from Uzbekistan | Ottawa |
| Minimum | 0.40% | 1.0% |
| Maximum | 10.3% | 16.6% |
| Range | 9.9% | 15.6% |
| Mean | 4.4% | 5.4% |
| Median | 4.2% | 5.0% |
| Interquartile 25% (IQ1) | 3.4% | 3.2% |
| Interquartile 75% (IQ3) | 5.5% | 6.2% |
| Interquartile Range (IQR) | 2.1% | 3.0% |
| Standard Deviation (Sample) | 1.8% | 3.4% |
| Standard Deviation (Population) | 1.8% | 3.3% |
Similar Demographics by Unemployment Among Ages 45 to 54 years
Demographics Similar to Immigrants from Uzbekistan by Unemployment Among Ages 45 to 54 years
In terms of unemployment among ages 45 to 54 years, the demographic groups most similar to Immigrants from Uzbekistan are Bahamian (4.9%, a difference of 0.090%), Ghanaian (4.9%, a difference of 0.18%), Immigrants from Somalia (4.9%, a difference of 0.30%), Somali (5.0%, a difference of 0.39%), and Immigrants from Ghana (5.0%, a difference of 0.53%).
| Demographics | Rating | Rank | Unemployment Among Ages 45 to 54 years |
| Guatemalans | 0.1 /100 | #261 | Tragic 4.9% |
| Mexicans | 0.1 /100 | #262 | Tragic 4.9% |
| Immigrants | Fiji | 0.1 /100 | #263 | Tragic 4.9% |
| Immigrants | Guatemala | 0.1 /100 | #264 | Tragic 4.9% |
| Immigrants | Somalia | 0.1 /100 | #265 | Tragic 4.9% |
| Ghanaians | 0.0 /100 | #266 | Tragic 4.9% |
| Bahamians | 0.0 /100 | #267 | Tragic 4.9% |
| Immigrants | Uzbekistan | 0.0 /100 | #268 | Tragic 4.9% |
| Somalis | 0.0 /100 | #269 | Tragic 5.0% |
| Immigrants | Ghana | 0.0 /100 | #270 | Tragic 5.0% |
| Cajuns | 0.0 /100 | #271 | Tragic 5.0% |
| Immigrants | Central America | 0.0 /100 | #272 | Tragic 5.0% |
| Immigrants | Latin America | 0.0 /100 | #273 | Tragic 5.0% |
| U.S. Virgin Islanders | 0.0 /100 | #274 | Tragic 5.0% |
| Bermudans | 0.0 /100 | #275 | Tragic 5.0% |
Demographics Similar to Ottawa by Unemployment Among Ages 45 to 54 years
In terms of unemployment among ages 45 to 54 years, the demographic groups most similar to Ottawa are Immigrants from Ireland (4.7%, a difference of 0.010%), Japanese (4.7%, a difference of 0.040%), Immigrants (4.7%, a difference of 0.040%), Soviet Union (4.7%, a difference of 0.060%), and Immigrants from Israel (4.7%, a difference of 0.12%).
| Demographics | Rating | Rank | Unemployment Among Ages 45 to 54 years |
| Immigrants | Norway | 4.8 /100 | #225 | Tragic 4.7% |
| Assyrians/Chaldeans/Syriacs | 3.5 /100 | #226 | Tragic 4.7% |
| Iraqis | 3.2 /100 | #227 | Tragic 4.7% |
| South American Indians | 3.1 /100 | #228 | Tragic 4.7% |
| Immigrants | Israel | 3.0 /100 | #229 | Tragic 4.7% |
| Japanese | 2.8 /100 | #230 | Tragic 4.7% |
| Immigrants | Ireland | 2.7 /100 | #231 | Tragic 4.7% |
| Ottawa | 2.7 /100 | #232 | Tragic 4.7% |
| Immigrants | Immigrants | 2.6 /100 | #233 | Tragic 4.7% |
| Soviet Union | 2.6 /100 | #234 | Tragic 4.7% |
| Cree | 2.3 /100 | #235 | Tragic 4.7% |
| Tlingit-Haida | 2.3 /100 | #236 | Tragic 4.7% |
| Alsatians | 1.6 /100 | #237 | Tragic 4.7% |
| Yaqui | 1.4 /100 | #238 | Tragic 4.7% |
| Spanish Americans | 1.4 /100 | #239 | Tragic 4.7% |