Immigrants from Bolivia vs Ottawa Unemployment Among Ages 45 to 54 years
COMPARE
Immigrants from Bolivia
Ottawa
Unemployment Among Ages 45 to 54 years
Unemployment Among Ages 45 to 54 years Comparison
Immigrants from Bolivia
Ottawa
4.0%
UNEMPLOYMENT AMONG AGES 45 TO 54 YEARS
100.0/ 100
METRIC RATING
15th/ 347
METRIC RANK
4.7%
UNEMPLOYMENT AMONG AGES 45 TO 54 YEARS
2.7/ 100
METRIC RATING
232nd/ 347
METRIC RANK
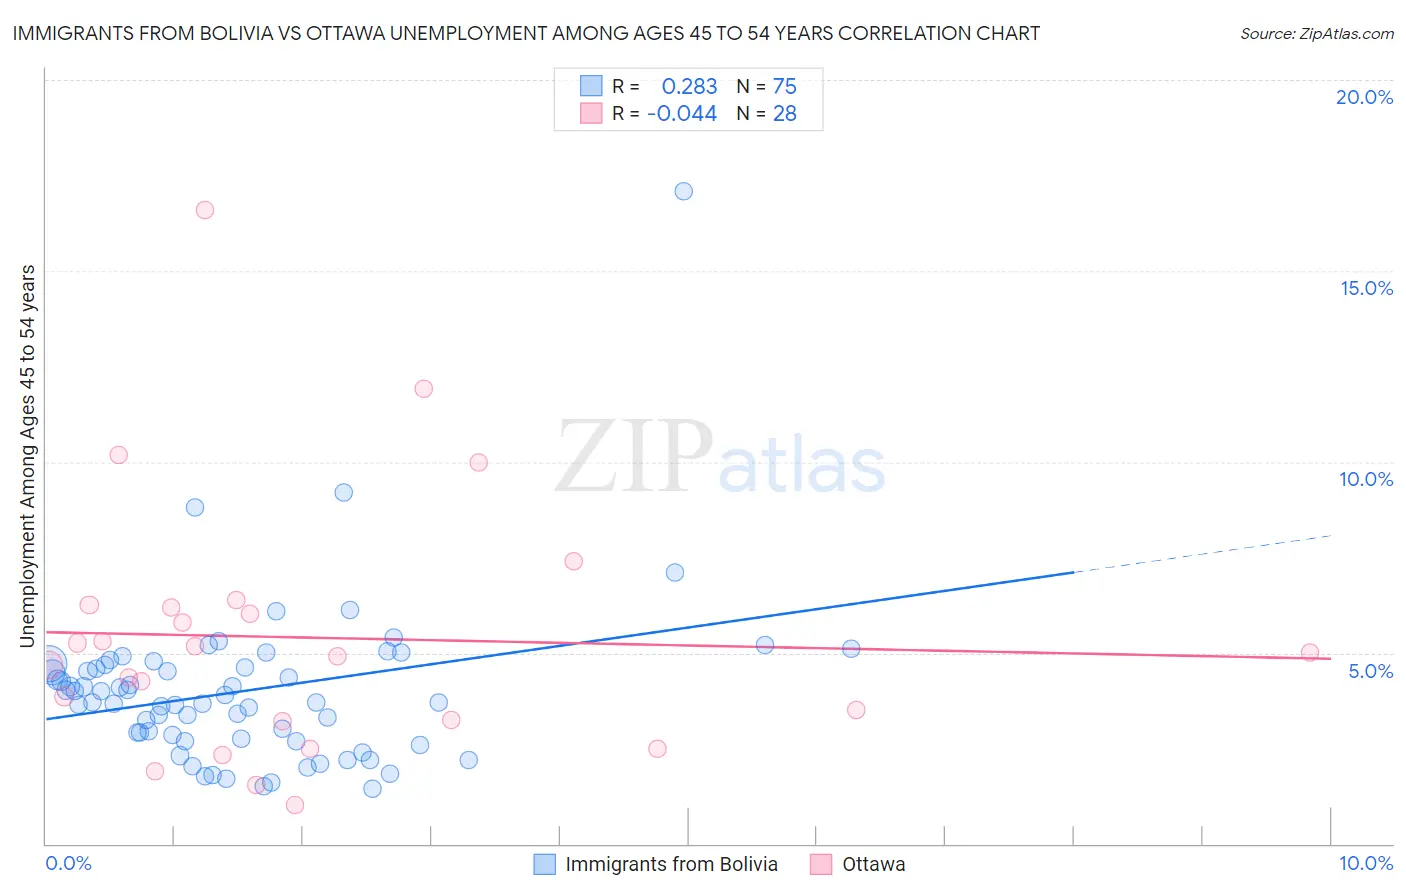
Immigrants from Bolivia vs Ottawa Unemployment Among Ages 45 to 54 years Correlation Chart
The statistical analysis conducted on geographies consisting of 157,469,512 people shows a weak positive correlation between the proportion of Immigrants from Bolivia and unemployment rate among population between the ages 45 and 54 in the United States with a correlation coefficient (R) of 0.283 and weighted average of 4.0%. Similarly, the statistical analysis conducted on geographies consisting of 49,375,752 people shows no correlation between the proportion of Ottawa and unemployment rate among population between the ages 45 and 54 in the United States with a correlation coefficient (R) of -0.044 and weighted average of 4.7%, a difference of 17.1%.
Unemployment Among Ages 45 to 54 years Correlation Summary
| Measurement | Immigrants from Bolivia | Ottawa |
| Minimum | 1.5% | 1.0% |
| Maximum | 17.1% | 16.6% |
| Range | 15.6% | 15.6% |
| Mean | 4.0% | 5.4% |
| Median | 3.7% | 5.0% |
| Interquartile 25% (IQ1) | 2.8% | 3.2% |
| Interquartile 75% (IQ3) | 4.7% | 6.2% |
| Interquartile Range (IQR) | 1.9% | 3.0% |
| Standard Deviation (Sample) | 2.1% | 3.4% |
| Standard Deviation (Population) | 2.1% | 3.3% |
Similar Demographics by Unemployment Among Ages 45 to 54 years
Demographics Similar to Immigrants from Bolivia by Unemployment Among Ages 45 to 54 years
In terms of unemployment among ages 45 to 54 years, the demographic groups most similar to Immigrants from Bolivia are Thai (4.0%, a difference of 0.19%), Immigrants from Bosnia and Herzegovina (4.0%, a difference of 0.43%), Cuban (4.0%, a difference of 0.48%), Swedish (4.0%, a difference of 0.63%), and Scandinavian (4.0%, a difference of 0.65%).
| Demographics | Rating | Rank | Unemployment Among Ages 45 to 54 years |
| Chinese | 100.0 /100 | #8 | Exceptional 4.0% |
| Czechs | 100.0 /100 | #9 | Exceptional 4.0% |
| Venezuelans | 100.0 /100 | #10 | Exceptional 4.0% |
| Scandinavians | 100.0 /100 | #11 | Exceptional 4.0% |
| Swedes | 100.0 /100 | #12 | Exceptional 4.0% |
| Cubans | 100.0 /100 | #13 | Exceptional 4.0% |
| Immigrants | Bosnia and Herzegovina | 100.0 /100 | #14 | Exceptional 4.0% |
| Immigrants | Bolivia | 100.0 /100 | #15 | Exceptional 4.0% |
| Thais | 100.0 /100 | #16 | Exceptional 4.0% |
| Tongans | 100.0 /100 | #17 | Exceptional 4.1% |
| Germans | 100.0 /100 | #18 | Exceptional 4.1% |
| Swiss | 100.0 /100 | #19 | Exceptional 4.1% |
| English | 100.0 /100 | #20 | Exceptional 4.1% |
| Europeans | 100.0 /100 | #21 | Exceptional 4.1% |
| Yugoslavians | 100.0 /100 | #22 | Exceptional 4.1% |
Demographics Similar to Ottawa by Unemployment Among Ages 45 to 54 years
In terms of unemployment among ages 45 to 54 years, the demographic groups most similar to Ottawa are Immigrants from Ireland (4.7%, a difference of 0.010%), Japanese (4.7%, a difference of 0.040%), Immigrants (4.7%, a difference of 0.040%), Soviet Union (4.7%, a difference of 0.060%), and Immigrants from Israel (4.7%, a difference of 0.12%).
| Demographics | Rating | Rank | Unemployment Among Ages 45 to 54 years |
| Immigrants | Norway | 4.8 /100 | #225 | Tragic 4.7% |
| Assyrians/Chaldeans/Syriacs | 3.5 /100 | #226 | Tragic 4.7% |
| Iraqis | 3.2 /100 | #227 | Tragic 4.7% |
| South American Indians | 3.1 /100 | #228 | Tragic 4.7% |
| Immigrants | Israel | 3.0 /100 | #229 | Tragic 4.7% |
| Japanese | 2.8 /100 | #230 | Tragic 4.7% |
| Immigrants | Ireland | 2.7 /100 | #231 | Tragic 4.7% |
| Ottawa | 2.7 /100 | #232 | Tragic 4.7% |
| Immigrants | Immigrants | 2.6 /100 | #233 | Tragic 4.7% |
| Soviet Union | 2.6 /100 | #234 | Tragic 4.7% |
| Cree | 2.3 /100 | #235 | Tragic 4.7% |
| Tlingit-Haida | 2.3 /100 | #236 | Tragic 4.7% |
| Alsatians | 1.6 /100 | #237 | Tragic 4.7% |
| Yaqui | 1.4 /100 | #238 | Tragic 4.7% |
| Spanish Americans | 1.4 /100 | #239 | Tragic 4.7% |