Immigrants from Uzbekistan vs Immigrants from Western Europe Unemployment Among Ages 45 to 54 years
COMPARE
Immigrants from Uzbekistan
Immigrants from Western Europe
Unemployment Among Ages 45 to 54 years
Unemployment Among Ages 45 to 54 years Comparison
Immigrants from Uzbekistan
Immigrants from Western Europe
4.9%
UNEMPLOYMENT AMONG AGES 45 TO 54 YEARS
0.0/ 100
METRIC RATING
268th/ 347
METRIC RANK
4.5%
UNEMPLOYMENT AMONG AGES 45 TO 54 YEARS
57.4/ 100
METRIC RATING
166th/ 347
METRIC RANK
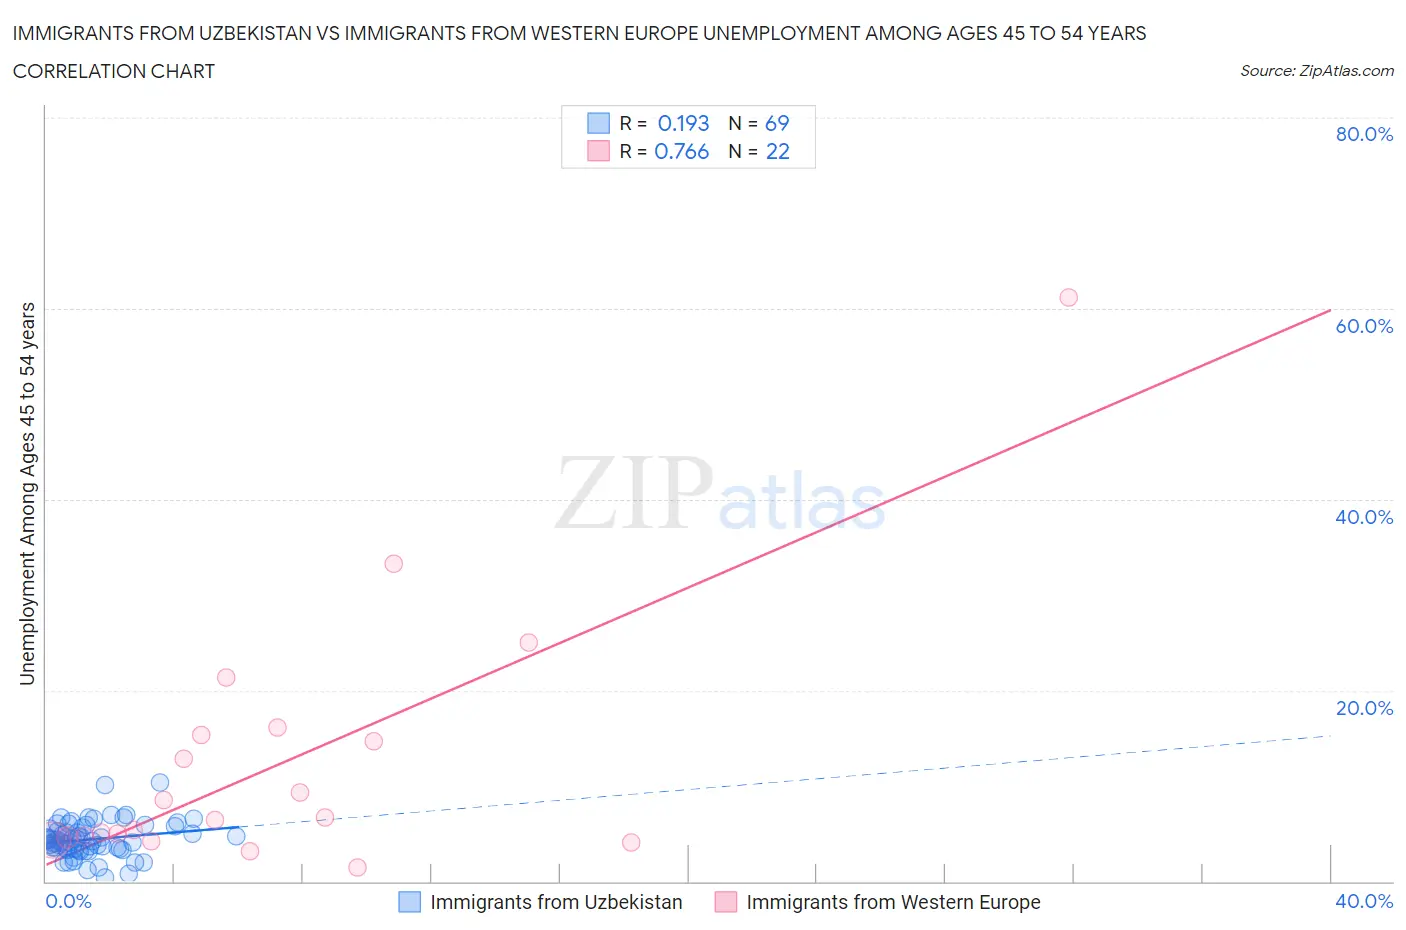
Immigrants from Uzbekistan vs Immigrants from Western Europe Unemployment Among Ages 45 to 54 years Correlation Chart
The statistical analysis conducted on geographies consisting of 117,964,969 people shows a poor positive correlation between the proportion of Immigrants from Uzbekistan and unemployment rate among population between the ages 45 and 54 in the United States with a correlation coefficient (R) of 0.193 and weighted average of 4.9%. Similarly, the statistical analysis conducted on geographies consisting of 473,073,431 people shows a strong positive correlation between the proportion of Immigrants from Western Europe and unemployment rate among population between the ages 45 and 54 in the United States with a correlation coefficient (R) of 0.766 and weighted average of 4.5%, a difference of 9.6%.
Unemployment Among Ages 45 to 54 years Correlation Summary
| Measurement | Immigrants from Uzbekistan | Immigrants from Western Europe |
| Minimum | 0.40% | 1.5% |
| Maximum | 10.3% | 61.1% |
| Range | 9.9% | 59.6% |
| Mean | 4.4% | 12.4% |
| Median | 4.2% | 6.5% |
| Interquartile 25% (IQ1) | 3.4% | 4.5% |
| Interquartile 75% (IQ3) | 5.5% | 15.3% |
| Interquartile Range (IQR) | 2.1% | 10.8% |
| Standard Deviation (Sample) | 1.8% | 13.6% |
| Standard Deviation (Population) | 1.8% | 13.2% |
Similar Demographics by Unemployment Among Ages 45 to 54 years
Demographics Similar to Immigrants from Uzbekistan by Unemployment Among Ages 45 to 54 years
In terms of unemployment among ages 45 to 54 years, the demographic groups most similar to Immigrants from Uzbekistan are Bahamian (4.9%, a difference of 0.090%), Ghanaian (4.9%, a difference of 0.18%), Immigrants from Somalia (4.9%, a difference of 0.30%), Somali (5.0%, a difference of 0.39%), and Immigrants from Ghana (5.0%, a difference of 0.53%).
| Demographics | Rating | Rank | Unemployment Among Ages 45 to 54 years |
| Guatemalans | 0.1 /100 | #261 | Tragic 4.9% |
| Mexicans | 0.1 /100 | #262 | Tragic 4.9% |
| Immigrants | Fiji | 0.1 /100 | #263 | Tragic 4.9% |
| Immigrants | Guatemala | 0.1 /100 | #264 | Tragic 4.9% |
| Immigrants | Somalia | 0.1 /100 | #265 | Tragic 4.9% |
| Ghanaians | 0.0 /100 | #266 | Tragic 4.9% |
| Bahamians | 0.0 /100 | #267 | Tragic 4.9% |
| Immigrants | Uzbekistan | 0.0 /100 | #268 | Tragic 4.9% |
| Somalis | 0.0 /100 | #269 | Tragic 5.0% |
| Immigrants | Ghana | 0.0 /100 | #270 | Tragic 5.0% |
| Cajuns | 0.0 /100 | #271 | Tragic 5.0% |
| Immigrants | Central America | 0.0 /100 | #272 | Tragic 5.0% |
| Immigrants | Latin America | 0.0 /100 | #273 | Tragic 5.0% |
| U.S. Virgin Islanders | 0.0 /100 | #274 | Tragic 5.0% |
| Bermudans | 0.0 /100 | #275 | Tragic 5.0% |
Demographics Similar to Immigrants from Western Europe by Unemployment Among Ages 45 to 54 years
In terms of unemployment among ages 45 to 54 years, the demographic groups most similar to Immigrants from Western Europe are Maltese (4.5%, a difference of 0.020%), Samoan (4.5%, a difference of 0.050%), Immigrants from Brazil (4.5%, a difference of 0.050%), Bangladeshi (4.5%, a difference of 0.11%), and Immigrants from Europe (4.5%, a difference of 0.13%).
| Demographics | Rating | Rank | Unemployment Among Ages 45 to 54 years |
| Immigrants | Nonimmigrants | 62.8 /100 | #159 | Good 4.5% |
| Immigrants | South Eastern Asia | 62.0 /100 | #160 | Good 4.5% |
| Immigrants | Eastern Europe | 61.6 /100 | #161 | Good 4.5% |
| Immigrants | Indonesia | 60.3 /100 | #162 | Good 4.5% |
| Bangladeshis | 59.7 /100 | #163 | Average 4.5% |
| Samoans | 58.5 /100 | #164 | Average 4.5% |
| Maltese | 57.9 /100 | #165 | Average 4.5% |
| Immigrants | Western Europe | 57.4 /100 | #166 | Average 4.5% |
| Immigrants | Brazil | 56.4 /100 | #167 | Average 4.5% |
| Immigrants | Europe | 54.7 /100 | #168 | Average 4.5% |
| Immigrants | Egypt | 54.7 /100 | #169 | Average 4.5% |
| Spaniards | 54.3 /100 | #170 | Average 4.5% |
| Egyptians | 53.6 /100 | #171 | Average 4.5% |
| Colombians | 53.3 /100 | #172 | Average 4.5% |
| Immigrants | Colombia | 52.0 /100 | #173 | Average 4.5% |