Immigrants from Uzbekistan vs Senegalese Unemployment Among Ages 45 to 54 years
COMPARE
Immigrants from Uzbekistan
Senegalese
Unemployment Among Ages 45 to 54 years
Unemployment Among Ages 45 to 54 years Comparison
Immigrants from Uzbekistan
Senegalese
4.9%
UNEMPLOYMENT AMONG AGES 45 TO 54 YEARS
0.0/ 100
METRIC RATING
268th/ 347
METRIC RANK
5.1%
UNEMPLOYMENT AMONG AGES 45 TO 54 YEARS
0.0/ 100
METRIC RATING
286th/ 347
METRIC RANK
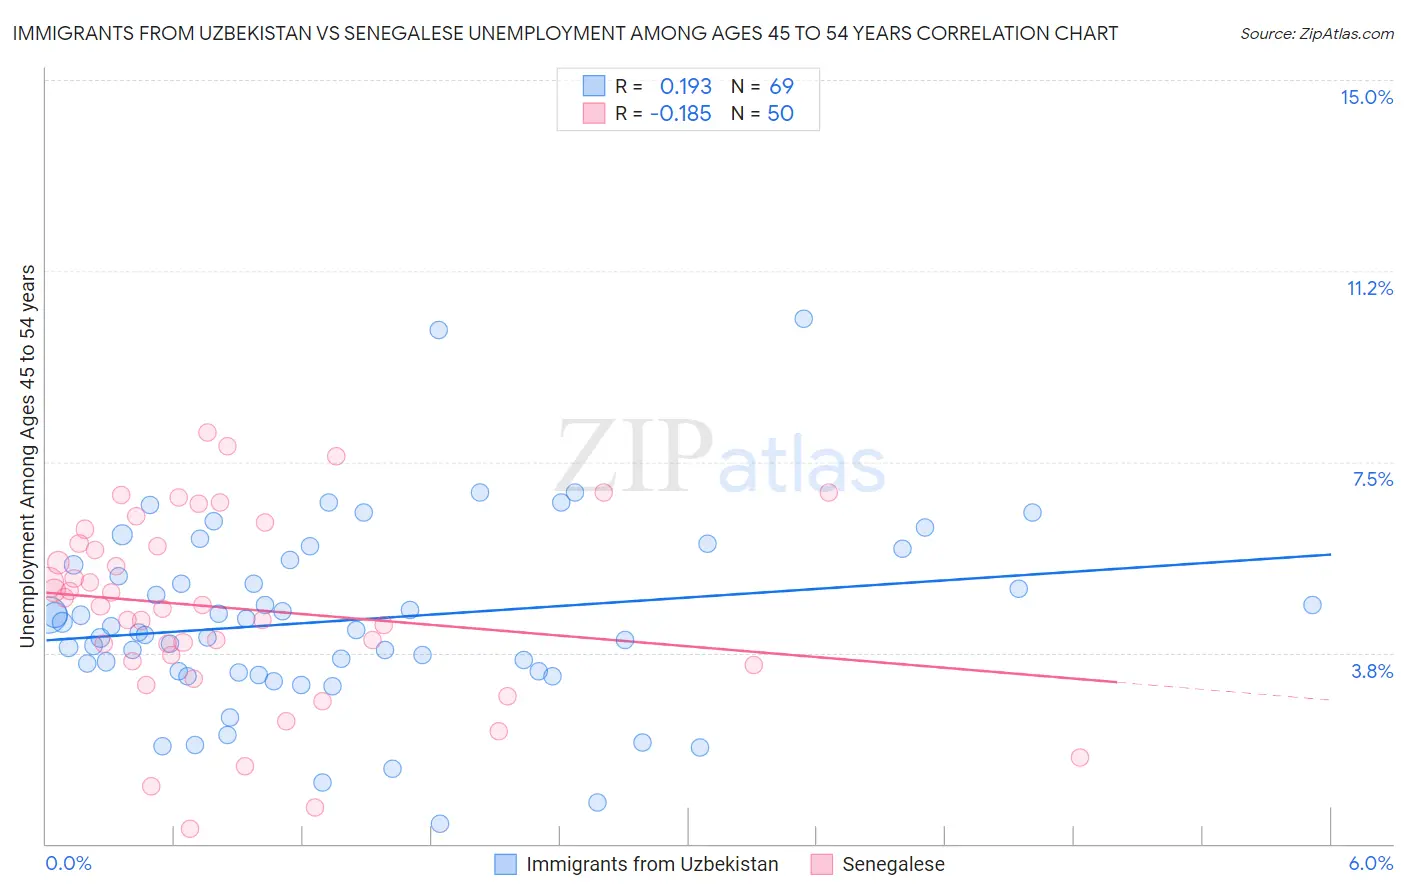
Immigrants from Uzbekistan vs Senegalese Unemployment Among Ages 45 to 54 years Correlation Chart
The statistical analysis conducted on geographies consisting of 117,964,969 people shows a poor positive correlation between the proportion of Immigrants from Uzbekistan and unemployment rate among population between the ages 45 and 54 in the United States with a correlation coefficient (R) of 0.193 and weighted average of 4.9%. Similarly, the statistical analysis conducted on geographies consisting of 77,807,393 people shows a poor negative correlation between the proportion of Senegalese and unemployment rate among population between the ages 45 and 54 in the United States with a correlation coefficient (R) of -0.185 and weighted average of 5.1%, a difference of 3.9%.
Unemployment Among Ages 45 to 54 years Correlation Summary
| Measurement | Immigrants from Uzbekistan | Senegalese |
| Minimum | 0.40% | 0.30% |
| Maximum | 10.3% | 8.1% |
| Range | 9.9% | 7.8% |
| Mean | 4.4% | 4.6% |
| Median | 4.2% | 4.7% |
| Interquartile 25% (IQ1) | 3.4% | 3.6% |
| Interquartile 75% (IQ3) | 5.5% | 5.9% |
| Interquartile Range (IQR) | 2.1% | 2.3% |
| Standard Deviation (Sample) | 1.8% | 1.8% |
| Standard Deviation (Population) | 1.8% | 1.8% |
Demographics Similar to Immigrants from Uzbekistan and Senegalese by Unemployment Among Ages 45 to 54 years
In terms of unemployment among ages 45 to 54 years, the demographic groups most similar to Immigrants from Uzbekistan are Bahamian (4.9%, a difference of 0.090%), Somali (5.0%, a difference of 0.39%), Immigrants from Ghana (5.0%, a difference of 0.53%), Cajun (5.0%, a difference of 0.60%), and Immigrants from Central America (5.0%, a difference of 0.78%). Similarly, the demographic groups most similar to Senegalese are Iroquois (5.1%, a difference of 0.16%), Kiowa (5.1%, a difference of 0.18%), Hispanic or Latino (5.1%, a difference of 0.83%), Haitian (5.2%, a difference of 0.83%), and African (5.1%, a difference of 1.3%).
| Demographics | Rating | Rank | Unemployment Among Ages 45 to 54 years |
| Bahamians | 0.0 /100 | #267 | Tragic 4.9% |
| Immigrants | Uzbekistan | 0.0 /100 | #268 | Tragic 4.9% |
| Somalis | 0.0 /100 | #269 | Tragic 5.0% |
| Immigrants | Ghana | 0.0 /100 | #270 | Tragic 5.0% |
| Cajuns | 0.0 /100 | #271 | Tragic 5.0% |
| Immigrants | Central America | 0.0 /100 | #272 | Tragic 5.0% |
| Immigrants | Latin America | 0.0 /100 | #273 | Tragic 5.0% |
| U.S. Virgin Islanders | 0.0 /100 | #274 | Tragic 5.0% |
| Bermudans | 0.0 /100 | #275 | Tragic 5.0% |
| French American Indians | 0.0 /100 | #276 | Tragic 5.0% |
| Immigrants | Mexico | 0.0 /100 | #277 | Tragic 5.0% |
| Dutch West Indians | 0.0 /100 | #278 | Tragic 5.0% |
| Nepalese | 0.0 /100 | #279 | Tragic 5.0% |
| Blackfeet | 0.0 /100 | #280 | Tragic 5.1% |
| Spanish American Indians | 0.0 /100 | #281 | Tragic 5.1% |
| Africans | 0.0 /100 | #282 | Tragic 5.1% |
| Hispanics or Latinos | 0.0 /100 | #283 | Tragic 5.1% |
| Kiowa | 0.0 /100 | #284 | Tragic 5.1% |
| Iroquois | 0.0 /100 | #285 | Tragic 5.1% |
| Senegalese | 0.0 /100 | #286 | Tragic 5.1% |
| Haitians | 0.0 /100 | #287 | Tragic 5.2% |