Dutch vs Immigrants from Central America Female Unemployment
COMPARE
Dutch
Immigrants from Central America
Female Unemployment
Female Unemployment Comparison
Dutch
Immigrants from Central America
4.6%
FEMALE UNEMPLOYMENT
100.0/ 100
METRIC RATING
12th/ 347
METRIC RANK
6.2%
FEMALE UNEMPLOYMENT
0.0/ 100
METRIC RATING
306th/ 347
METRIC RANK
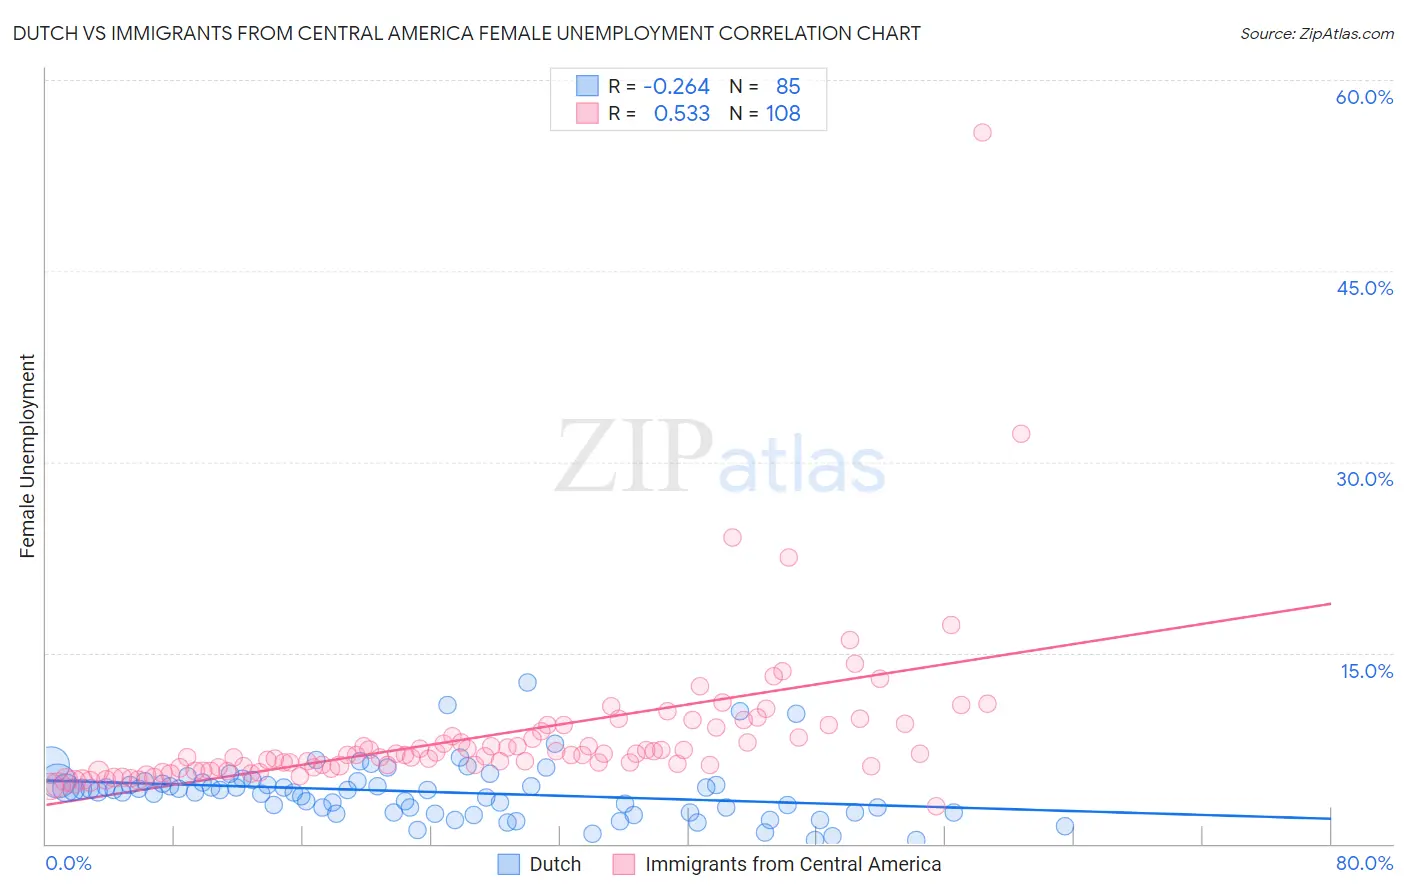
Dutch vs Immigrants from Central America Female Unemployment Correlation Chart
The statistical analysis conducted on geographies consisting of 542,310,807 people shows a weak negative correlation between the proportion of Dutch and unemploymnet rate among females in the United States with a correlation coefficient (R) of -0.264 and weighted average of 4.6%. Similarly, the statistical analysis conducted on geographies consisting of 528,420,242 people shows a substantial positive correlation between the proportion of Immigrants from Central America and unemploymnet rate among females in the United States with a correlation coefficient (R) of 0.533 and weighted average of 6.2%, a difference of 35.6%.
Female Unemployment Correlation Summary
| Measurement | Dutch | Immigrants from Central America |
| Minimum | 0.30% | 2.9% |
| Maximum | 12.7% | 55.9% |
| Range | 12.4% | 53.0% |
| Mean | 4.1% | 8.5% |
| Median | 4.2% | 7.0% |
| Interquartile 25% (IQ1) | 2.5% | 6.0% |
| Interquartile 75% (IQ3) | 4.8% | 9.0% |
| Interquartile Range (IQR) | 2.3% | 3.0% |
| Standard Deviation (Sample) | 2.2% | 6.1% |
| Standard Deviation (Population) | 2.2% | 6.1% |
Similar Demographics by Female Unemployment
Demographics Similar to Dutch by Female Unemployment
In terms of female unemployment, the demographic groups most similar to Dutch are Belgian (4.6%, a difference of 0.15%), Scandinavian (4.6%, a difference of 0.59%), Swiss (4.6%, a difference of 0.71%), Finnish (4.6%, a difference of 0.75%), and English (4.6%, a difference of 0.94%).
| Demographics | Rating | Rank | Female Unemployment |
| Hmong | 100.0 /100 | #5 | Exceptional 4.4% |
| Swedes | 100.0 /100 | #6 | Exceptional 4.4% |
| Chinese | 100.0 /100 | #7 | Exceptional 4.5% |
| Germans | 100.0 /100 | #8 | Exceptional 4.5% |
| Slovenes | 100.0 /100 | #9 | Exceptional 4.5% |
| Swiss | 100.0 /100 | #10 | Exceptional 4.6% |
| Scandinavians | 100.0 /100 | #11 | Exceptional 4.6% |
| Dutch | 100.0 /100 | #12 | Exceptional 4.6% |
| Belgians | 100.0 /100 | #13 | Exceptional 4.6% |
| Finns | 100.0 /100 | #14 | Exceptional 4.6% |
| English | 100.0 /100 | #15 | Exceptional 4.6% |
| Carpatho Rusyns | 99.9 /100 | #16 | Exceptional 4.7% |
| Croatians | 99.9 /100 | #17 | Exceptional 4.7% |
| Latvians | 99.9 /100 | #18 | Exceptional 4.7% |
| Poles | 99.9 /100 | #19 | Exceptional 4.7% |
Demographics Similar to Immigrants from Central America by Female Unemployment
In terms of female unemployment, the demographic groups most similar to Immigrants from Central America are Shoshone (6.2%, a difference of 0.010%), Hispanic or Latino (6.2%, a difference of 0.070%), Spanish American Indian (6.2%, a difference of 0.16%), Immigrants from Jamaica (6.2%, a difference of 0.21%), and Barbadian (6.2%, a difference of 0.58%).
| Demographics | Rating | Rank | Female Unemployment |
| Ute | 0.0 /100 | #299 | Tragic 6.1% |
| Immigrants | Haiti | 0.0 /100 | #300 | Tragic 6.1% |
| Immigrants | Barbados | 0.0 /100 | #301 | Tragic 6.2% |
| U.S. Virgin Islanders | 0.0 /100 | #302 | Tragic 6.2% |
| Barbadians | 0.0 /100 | #303 | Tragic 6.2% |
| Immigrants | Jamaica | 0.0 /100 | #304 | Tragic 6.2% |
| Spanish American Indians | 0.0 /100 | #305 | Tragic 6.2% |
| Immigrants | Central America | 0.0 /100 | #306 | Tragic 6.2% |
| Shoshone | 0.0 /100 | #307 | Tragic 6.2% |
| Hispanics or Latinos | 0.0 /100 | #308 | Tragic 6.2% |
| Ecuadorians | 0.0 /100 | #309 | Tragic 6.3% |
| Central American Indians | 0.0 /100 | #310 | Tragic 6.3% |
| Immigrants | Mexico | 0.0 /100 | #311 | Tragic 6.3% |
| Immigrants | Grenada | 0.0 /100 | #312 | Tragic 6.3% |
| Belizeans | 0.0 /100 | #313 | Tragic 6.3% |