Immigrants from Uganda vs Immigrants from Dominica Unemployment Among Ages 16 to 19 years
COMPARE
Immigrants from Uganda
Immigrants from Dominica
Unemployment Among Ages 16 to 19 years
Unemployment Among Ages 16 to 19 years Comparison
Immigrants from Uganda
Immigrants from Dominica
16.5%
UNEMPLOYMENT AMONG AGES 16 TO 19 YEARS
99.4/ 100
METRIC RATING
58th/ 347
METRIC RANK
21.9%
UNEMPLOYMENT AMONG AGES 16 TO 19 YEARS
0.0/ 100
METRIC RATING
315th/ 347
METRIC RANK
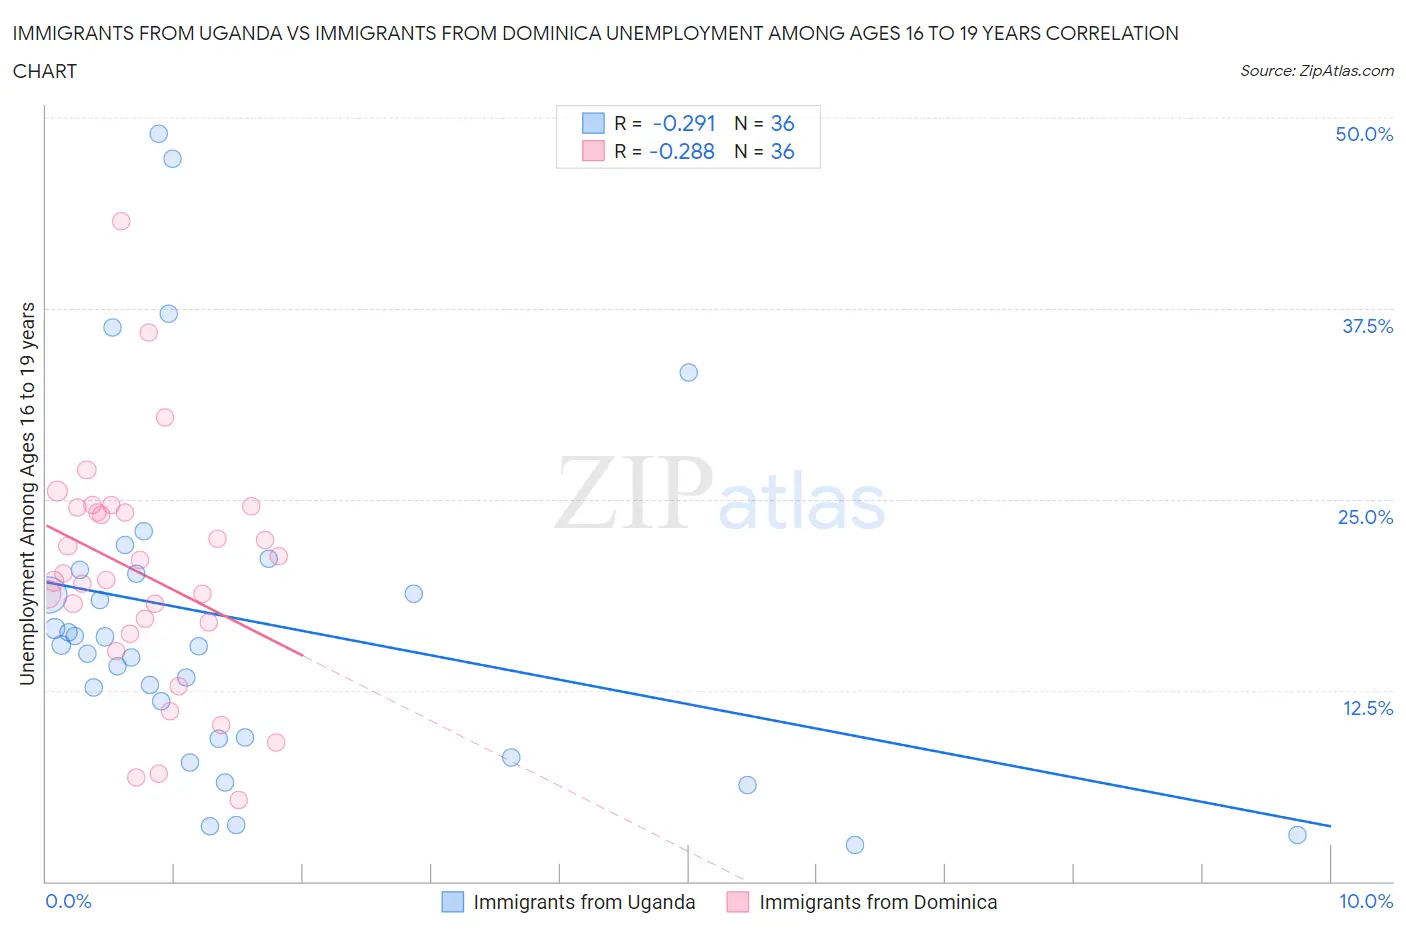
Immigrants from Uganda vs Immigrants from Dominica Unemployment Among Ages 16 to 19 years Correlation Chart
The statistical analysis conducted on geographies consisting of 124,056,467 people shows a weak negative correlation between the proportion of Immigrants from Uganda and unemployment rate among population between the ages 16 and 19 in the United States with a correlation coefficient (R) of -0.291 and weighted average of 16.5%. Similarly, the statistical analysis conducted on geographies consisting of 82,974,472 people shows a weak negative correlation between the proportion of Immigrants from Dominica and unemployment rate among population between the ages 16 and 19 in the United States with a correlation coefficient (R) of -0.288 and weighted average of 21.9%, a difference of 32.8%.
Unemployment Among Ages 16 to 19 years Correlation Summary
| Measurement | Immigrants from Uganda | Immigrants from Dominica |
| Minimum | 2.4% | 5.3% |
| Maximum | 48.9% | 43.2% |
| Range | 46.5% | 37.9% |
| Mean | 17.1% | 20.1% |
| Median | 15.4% | 19.9% |
| Interquartile 25% (IQ1) | 9.3% | 16.6% |
| Interquartile 75% (IQ3) | 20.2% | 24.3% |
| Interquartile Range (IQR) | 10.9% | 7.7% |
| Standard Deviation (Sample) | 11.3% | 7.7% |
| Standard Deviation (Population) | 11.1% | 7.6% |
Similar Demographics by Unemployment Among Ages 16 to 19 years
Demographics Similar to Immigrants from Uganda by Unemployment Among Ages 16 to 19 years
In terms of unemployment among ages 16 to 19 years, the demographic groups most similar to Immigrants from Uganda are Immigrants from Jordan (16.5%, a difference of 0.050%), Irish (16.5%, a difference of 0.050%), Menominee (16.6%, a difference of 0.22%), Immigrants from Cuba (16.6%, a difference of 0.28%), and Sri Lankan (16.5%, a difference of 0.33%).
| Demographics | Rating | Rank | Unemployment Among Ages 16 to 19 years |
| Lebanese | 99.6 /100 | #51 | Exceptional 16.4% |
| Welsh | 99.6 /100 | #52 | Exceptional 16.4% |
| Slovenes | 99.6 /100 | #53 | Exceptional 16.4% |
| British | 99.5 /100 | #54 | Exceptional 16.5% |
| Czechoslovakians | 99.5 /100 | #55 | Exceptional 16.5% |
| Sri Lankans | 99.5 /100 | #56 | Exceptional 16.5% |
| Immigrants | Jordan | 99.4 /100 | #57 | Exceptional 16.5% |
| Immigrants | Uganda | 99.4 /100 | #58 | Exceptional 16.5% |
| Irish | 99.4 /100 | #59 | Exceptional 16.5% |
| Menominee | 99.3 /100 | #60 | Exceptional 16.6% |
| Immigrants | Cuba | 99.2 /100 | #61 | Exceptional 16.6% |
| Macedonians | 99.2 /100 | #62 | Exceptional 16.6% |
| Scotch-Irish | 99.1 /100 | #63 | Exceptional 16.6% |
| Northern Europeans | 99.0 /100 | #64 | Exceptional 16.6% |
| Immigrants | Japan | 98.9 /100 | #65 | Exceptional 16.6% |
Demographics Similar to Immigrants from Dominica by Unemployment Among Ages 16 to 19 years
In terms of unemployment among ages 16 to 19 years, the demographic groups most similar to Immigrants from Dominica are Tohono O'odham (22.1%, a difference of 0.54%), Alaska Native (21.8%, a difference of 0.85%), Immigrants from Belize (22.2%, a difference of 0.99%), Jamaican (21.7%, a difference of 1.0%), and Immigrants from Jamaica (22.2%, a difference of 1.1%).
| Demographics | Rating | Rank | Unemployment Among Ages 16 to 19 years |
| Immigrants | Bangladesh | 0.0 /100 | #308 | Tragic 21.5% |
| Natives/Alaskans | 0.0 /100 | #309 | Tragic 21.5% |
| Vietnamese | 0.0 /100 | #310 | Tragic 21.5% |
| Belizeans | 0.0 /100 | #311 | Tragic 21.6% |
| Houma | 0.0 /100 | #312 | Tragic 21.6% |
| Jamaicans | 0.0 /100 | #313 | Tragic 21.7% |
| Alaska Natives | 0.0 /100 | #314 | Tragic 21.8% |
| Immigrants | Dominica | 0.0 /100 | #315 | Tragic 21.9% |
| Tohono O'odham | 0.0 /100 | #316 | Tragic 22.1% |
| Immigrants | Belize | 0.0 /100 | #317 | Tragic 22.2% |
| Immigrants | Jamaica | 0.0 /100 | #318 | Tragic 22.2% |
| Immigrants | West Indies | 0.0 /100 | #319 | Tragic 22.2% |
| Cheyenne | 0.0 /100 | #320 | Tragic 22.3% |
| West Indians | 0.0 /100 | #321 | Tragic 22.4% |
| Barbadians | 0.0 /100 | #322 | Tragic 22.5% |