Immigrants from Honduras vs Immigrants from Dominica Unemployment Among Ages 16 to 19 years
COMPARE
Immigrants from Honduras
Immigrants from Dominica
Unemployment Among Ages 16 to 19 years
Unemployment Among Ages 16 to 19 years Comparison
Immigrants from Honduras
Immigrants from Dominica
19.0%
UNEMPLOYMENT AMONG AGES 16 TO 19 YEARS
0.1/ 100
METRIC RATING
266th/ 347
METRIC RANK
21.9%
UNEMPLOYMENT AMONG AGES 16 TO 19 YEARS
0.0/ 100
METRIC RATING
315th/ 347
METRIC RANK
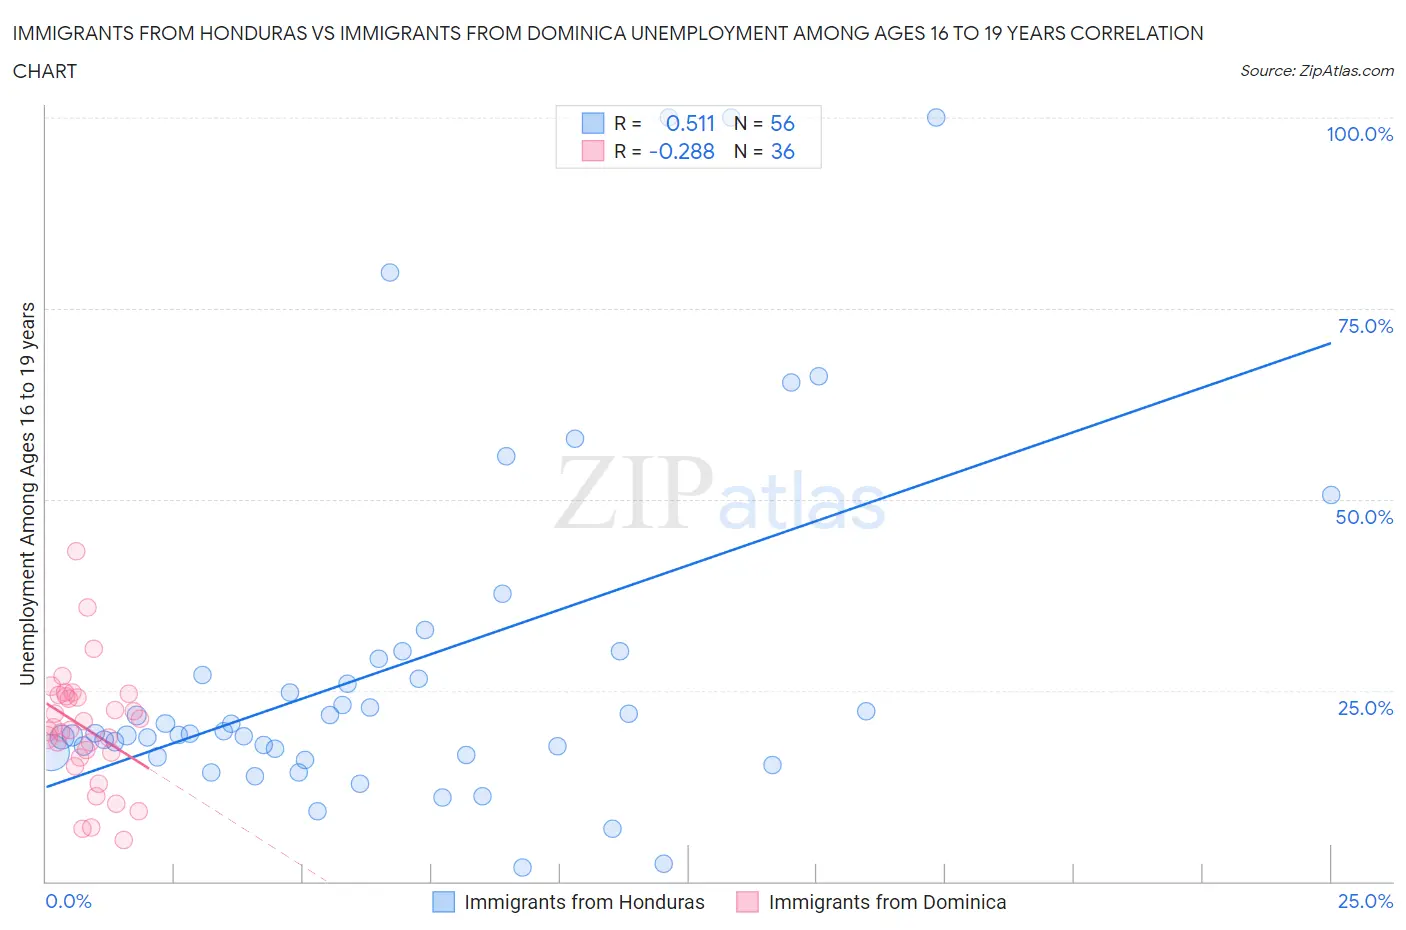
Immigrants from Honduras vs Immigrants from Dominica Unemployment Among Ages 16 to 19 years Correlation Chart
The statistical analysis conducted on geographies consisting of 310,823,514 people shows a substantial positive correlation between the proportion of Immigrants from Honduras and unemployment rate among population between the ages 16 and 19 in the United States with a correlation coefficient (R) of 0.511 and weighted average of 19.0%. Similarly, the statistical analysis conducted on geographies consisting of 82,974,472 people shows a weak negative correlation between the proportion of Immigrants from Dominica and unemployment rate among population between the ages 16 and 19 in the United States with a correlation coefficient (R) of -0.288 and weighted average of 21.9%, a difference of 15.6%.
Unemployment Among Ages 16 to 19 years Correlation Summary
| Measurement | Immigrants from Honduras | Immigrants from Dominica |
| Minimum | 1.8% | 5.3% |
| Maximum | 100.0% | 43.2% |
| Range | 98.2% | 37.9% |
| Mean | 28.1% | 20.1% |
| Median | 19.4% | 19.9% |
| Interquartile 25% (IQ1) | 16.7% | 16.6% |
| Interquartile 75% (IQ3) | 28.0% | 24.3% |
| Interquartile Range (IQR) | 11.4% | 7.7% |
| Standard Deviation (Sample) | 23.1% | 7.7% |
| Standard Deviation (Population) | 22.9% | 7.6% |
Similar Demographics by Unemployment Among Ages 16 to 19 years
Demographics Similar to Immigrants from Honduras by Unemployment Among Ages 16 to 19 years
In terms of unemployment among ages 16 to 19 years, the demographic groups most similar to Immigrants from Honduras are Choctaw (19.0%, a difference of 0.090%), Yaqui (19.0%, a difference of 0.10%), Cree (19.0%, a difference of 0.13%), Salvadoran (18.9%, a difference of 0.26%), and Spanish American Indian (18.9%, a difference of 0.30%).
| Demographics | Rating | Rank | Unemployment Among Ages 16 to 19 years |
| Immigrants | Central America | 0.2 /100 | #259 | Tragic 18.9% |
| Nigerians | 0.2 /100 | #260 | Tragic 18.9% |
| Spanish American Indians | 0.1 /100 | #261 | Tragic 18.9% |
| Salvadorans | 0.1 /100 | #262 | Tragic 18.9% |
| Cree | 0.1 /100 | #263 | Tragic 19.0% |
| Yaqui | 0.1 /100 | #264 | Tragic 19.0% |
| Choctaw | 0.1 /100 | #265 | Tragic 19.0% |
| Immigrants | Honduras | 0.1 /100 | #266 | Tragic 19.0% |
| Israelis | 0.1 /100 | #267 | Tragic 19.0% |
| Immigrants | El Salvador | 0.1 /100 | #268 | Tragic 19.1% |
| Lumbee | 0.1 /100 | #269 | Tragic 19.1% |
| Hondurans | 0.1 /100 | #270 | Tragic 19.2% |
| Blackfeet | 0.0 /100 | #271 | Tragic 19.2% |
| Hispanics or Latinos | 0.0 /100 | #272 | Tragic 19.2% |
| Immigrants | Panama | 0.0 /100 | #273 | Tragic 19.3% |
Demographics Similar to Immigrants from Dominica by Unemployment Among Ages 16 to 19 years
In terms of unemployment among ages 16 to 19 years, the demographic groups most similar to Immigrants from Dominica are Tohono O'odham (22.1%, a difference of 0.54%), Alaska Native (21.8%, a difference of 0.85%), Immigrants from Belize (22.2%, a difference of 0.99%), Jamaican (21.7%, a difference of 1.0%), and Immigrants from Jamaica (22.2%, a difference of 1.1%).
| Demographics | Rating | Rank | Unemployment Among Ages 16 to 19 years |
| Immigrants | Bangladesh | 0.0 /100 | #308 | Tragic 21.5% |
| Natives/Alaskans | 0.0 /100 | #309 | Tragic 21.5% |
| Vietnamese | 0.0 /100 | #310 | Tragic 21.5% |
| Belizeans | 0.0 /100 | #311 | Tragic 21.6% |
| Houma | 0.0 /100 | #312 | Tragic 21.6% |
| Jamaicans | 0.0 /100 | #313 | Tragic 21.7% |
| Alaska Natives | 0.0 /100 | #314 | Tragic 21.8% |
| Immigrants | Dominica | 0.0 /100 | #315 | Tragic 21.9% |
| Tohono O'odham | 0.0 /100 | #316 | Tragic 22.1% |
| Immigrants | Belize | 0.0 /100 | #317 | Tragic 22.2% |
| Immigrants | Jamaica | 0.0 /100 | #318 | Tragic 22.2% |
| Immigrants | West Indies | 0.0 /100 | #319 | Tragic 22.2% |
| Cheyenne | 0.0 /100 | #320 | Tragic 22.3% |
| West Indians | 0.0 /100 | #321 | Tragic 22.4% |
| Barbadians | 0.0 /100 | #322 | Tragic 22.5% |