Latvian vs Immigrants from Dominica Unemployment Among Ages 16 to 19 years
COMPARE
Latvian
Immigrants from Dominica
Unemployment Among Ages 16 to 19 years
Unemployment Among Ages 16 to 19 years Comparison
Latvians
Immigrants from Dominica
16.7%
UNEMPLOYMENT AMONG AGES 16 TO 19 YEARS
98.5/ 100
METRIC RATING
71st/ 347
METRIC RANK
21.9%
UNEMPLOYMENT AMONG AGES 16 TO 19 YEARS
0.0/ 100
METRIC RATING
315th/ 347
METRIC RANK
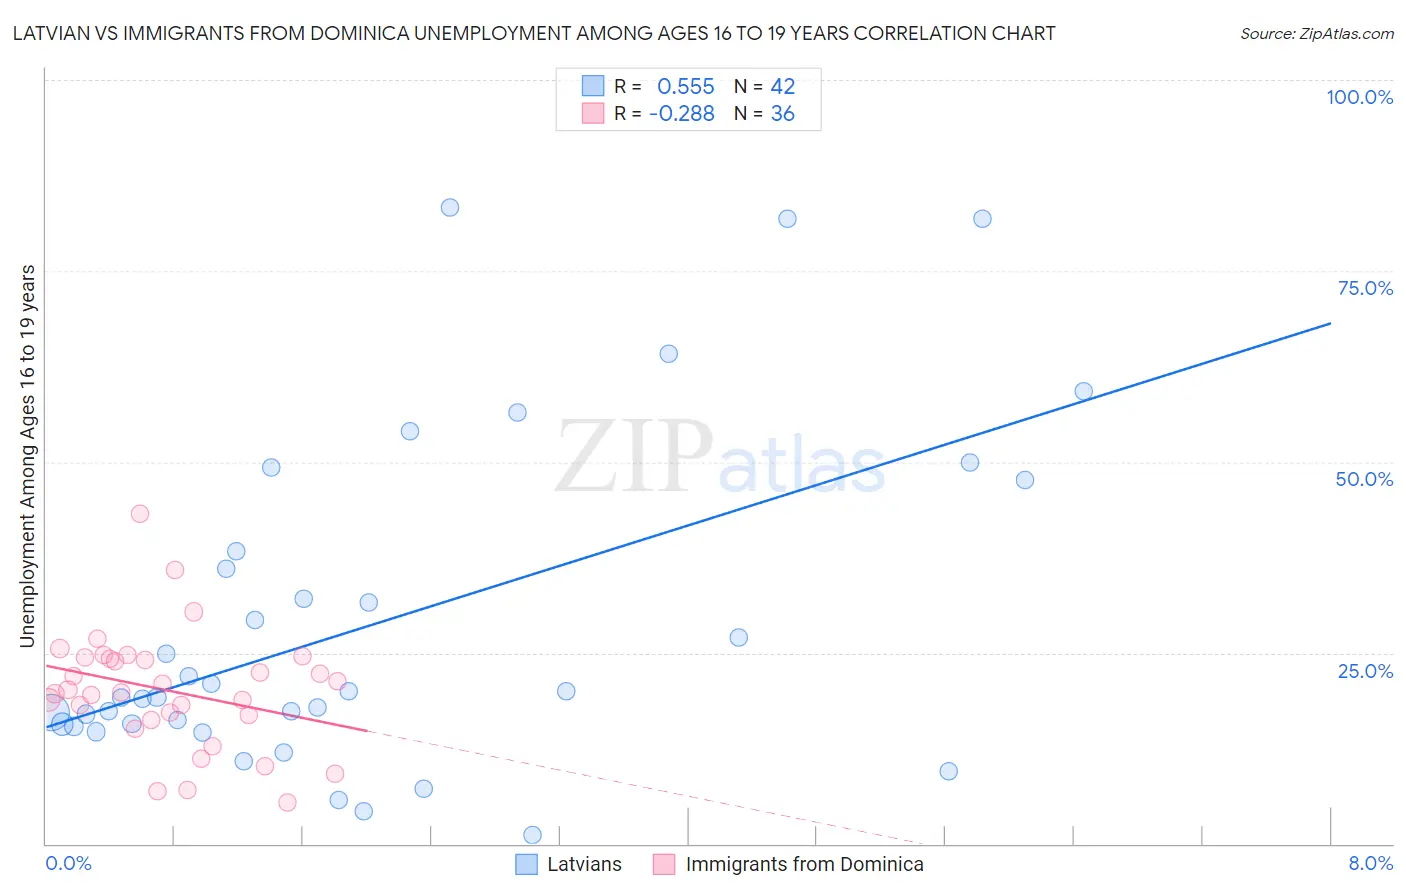
Latvian vs Immigrants from Dominica Unemployment Among Ages 16 to 19 years Correlation Chart
The statistical analysis conducted on geographies consisting of 211,944,479 people shows a substantial positive correlation between the proportion of Latvians and unemployment rate among population between the ages 16 and 19 in the United States with a correlation coefficient (R) of 0.555 and weighted average of 16.7%. Similarly, the statistical analysis conducted on geographies consisting of 82,974,472 people shows a weak negative correlation between the proportion of Immigrants from Dominica and unemployment rate among population between the ages 16 and 19 in the United States with a correlation coefficient (R) of -0.288 and weighted average of 21.9%, a difference of 31.3%.
Unemployment Among Ages 16 to 19 years Correlation Summary
| Measurement | Latvian | Immigrants from Dominica |
| Minimum | 1.1% | 5.3% |
| Maximum | 83.3% | 43.2% |
| Range | 82.2% | 37.9% |
| Mean | 29.0% | 20.1% |
| Median | 19.6% | 19.9% |
| Interquartile 25% (IQ1) | 15.7% | 16.6% |
| Interquartile 75% (IQ3) | 38.4% | 24.3% |
| Interquartile Range (IQR) | 22.7% | 7.7% |
| Standard Deviation (Sample) | 21.6% | 7.7% |
| Standard Deviation (Population) | 21.4% | 7.6% |
Similar Demographics by Unemployment Among Ages 16 to 19 years
Demographics Similar to Latvians by Unemployment Among Ages 16 to 19 years
In terms of unemployment among ages 16 to 19 years, the demographic groups most similar to Latvians are Immigrants from Canada (16.7%, a difference of 0.040%), Austrian (16.7%, a difference of 0.060%), Serbian (16.7%, a difference of 0.13%), Slavic (16.7%, a difference of 0.20%), and Chickasaw (16.7%, a difference of 0.20%).
| Demographics | Rating | Rank | Unemployment Among Ages 16 to 19 years |
| Northern Europeans | 99.0 /100 | #64 | Exceptional 16.6% |
| Immigrants | Japan | 98.9 /100 | #65 | Exceptional 16.6% |
| Okinawans | 98.9 /100 | #66 | Exceptional 16.6% |
| Slavs | 98.7 /100 | #67 | Exceptional 16.7% |
| Chickasaw | 98.7 /100 | #68 | Exceptional 16.7% |
| Serbians | 98.7 /100 | #69 | Exceptional 16.7% |
| Austrians | 98.6 /100 | #70 | Exceptional 16.7% |
| Latvians | 98.5 /100 | #71 | Exceptional 16.7% |
| Immigrants | Canada | 98.5 /100 | #72 | Exceptional 16.7% |
| Lithuanians | 98.2 /100 | #73 | Exceptional 16.7% |
| Immigrants | Eastern Africa | 98.1 /100 | #74 | Exceptional 16.8% |
| New Zealanders | 98.0 /100 | #75 | Exceptional 16.8% |
| Immigrants | North America | 97.9 /100 | #76 | Exceptional 16.8% |
| Immigrants | Singapore | 97.8 /100 | #77 | Exceptional 16.8% |
| Soviet Union | 97.8 /100 | #78 | Exceptional 16.8% |
Demographics Similar to Immigrants from Dominica by Unemployment Among Ages 16 to 19 years
In terms of unemployment among ages 16 to 19 years, the demographic groups most similar to Immigrants from Dominica are Tohono O'odham (22.1%, a difference of 0.54%), Alaska Native (21.8%, a difference of 0.85%), Immigrants from Belize (22.2%, a difference of 0.99%), Jamaican (21.7%, a difference of 1.0%), and Immigrants from Jamaica (22.2%, a difference of 1.1%).
| Demographics | Rating | Rank | Unemployment Among Ages 16 to 19 years |
| Immigrants | Bangladesh | 0.0 /100 | #308 | Tragic 21.5% |
| Natives/Alaskans | 0.0 /100 | #309 | Tragic 21.5% |
| Vietnamese | 0.0 /100 | #310 | Tragic 21.5% |
| Belizeans | 0.0 /100 | #311 | Tragic 21.6% |
| Houma | 0.0 /100 | #312 | Tragic 21.6% |
| Jamaicans | 0.0 /100 | #313 | Tragic 21.7% |
| Alaska Natives | 0.0 /100 | #314 | Tragic 21.8% |
| Immigrants | Dominica | 0.0 /100 | #315 | Tragic 21.9% |
| Tohono O'odham | 0.0 /100 | #316 | Tragic 22.1% |
| Immigrants | Belize | 0.0 /100 | #317 | Tragic 22.2% |
| Immigrants | Jamaica | 0.0 /100 | #318 | Tragic 22.2% |
| Immigrants | West Indies | 0.0 /100 | #319 | Tragic 22.2% |
| Cheyenne | 0.0 /100 | #320 | Tragic 22.3% |
| West Indians | 0.0 /100 | #321 | Tragic 22.4% |
| Barbadians | 0.0 /100 | #322 | Tragic 22.5% |