Immigrants from Uganda vs Immigrants from Dominica Male Unemployment
COMPARE
Immigrants from Uganda
Immigrants from Dominica
Male Unemployment
Male Unemployment Comparison
Immigrants from Uganda
Immigrants from Dominica
5.4%
MALE UNEMPLOYMENT
28.8/ 100
METRIC RATING
190th/ 347
METRIC RANK
7.0%
MALE UNEMPLOYMENT
0.0/ 100
METRIC RATING
313th/ 347
METRIC RANK
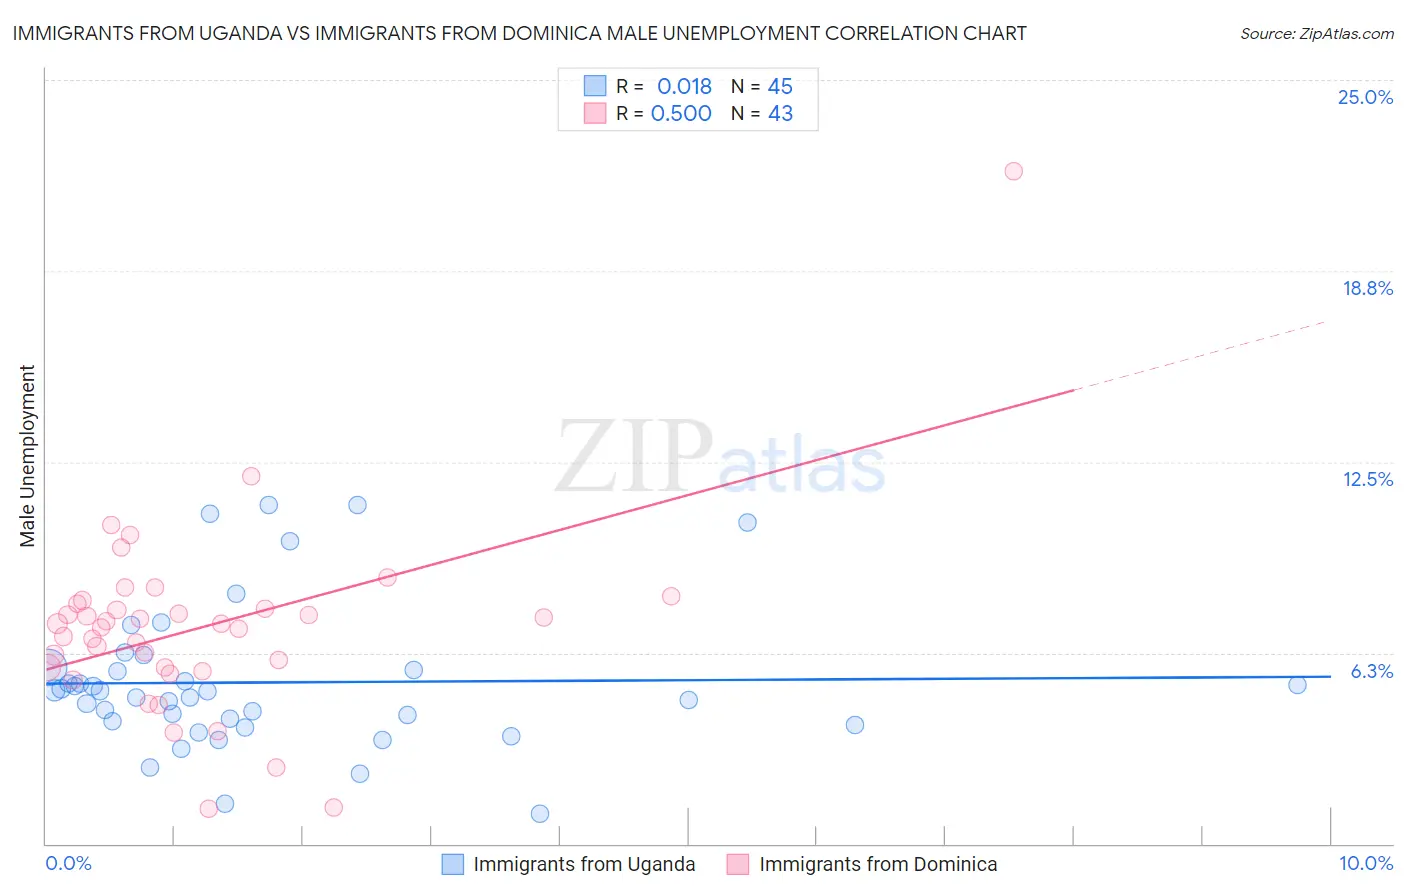
Immigrants from Uganda vs Immigrants from Dominica Male Unemployment Correlation Chart
The statistical analysis conducted on geographies consisting of 125,897,340 people shows no correlation between the proportion of Immigrants from Uganda and unemployment rate among males in the United States with a correlation coefficient (R) of 0.018 and weighted average of 5.4%. Similarly, the statistical analysis conducted on geographies consisting of 83,742,223 people shows a moderate positive correlation between the proportion of Immigrants from Dominica and unemployment rate among males in the United States with a correlation coefficient (R) of 0.500 and weighted average of 7.0%, a difference of 30.6%.
Male Unemployment Correlation Summary
| Measurement | Immigrants from Uganda | Immigrants from Dominica |
| Minimum | 1.0% | 1.2% |
| Maximum | 11.1% | 22.0% |
| Range | 10.1% | 20.8% |
| Mean | 5.3% | 7.1% |
| Median | 5.0% | 7.2% |
| Interquartile 25% (IQ1) | 4.0% | 5.8% |
| Interquartile 75% (IQ3) | 5.7% | 7.9% |
| Interquartile Range (IQR) | 1.8% | 2.1% |
| Standard Deviation (Sample) | 2.4% | 3.2% |
| Standard Deviation (Population) | 2.3% | 3.1% |
Similar Demographics by Male Unemployment
Demographics Similar to Immigrants from Uganda by Male Unemployment
In terms of male unemployment, the demographic groups most similar to Immigrants from Uganda are Immigrants from South America (5.4%, a difference of 0.040%), Immigrants from South Eastern Asia (5.4%, a difference of 0.040%), Arab (5.4%, a difference of 0.10%), Costa Rican (5.4%, a difference of 0.18%), and Iraqi (5.4%, a difference of 0.19%).
| Demographics | Rating | Rank | Male Unemployment |
| Taiwanese | 37.6 /100 | #183 | Fair 5.3% |
| Spaniards | 35.1 /100 | #184 | Fair 5.3% |
| Koreans | 34.9 /100 | #185 | Fair 5.3% |
| Iraqis | 31.6 /100 | #186 | Fair 5.4% |
| Costa Ricans | 31.3 /100 | #187 | Fair 5.4% |
| Arabs | 30.2 /100 | #188 | Fair 5.4% |
| Immigrants | South America | 29.4 /100 | #189 | Fair 5.4% |
| Immigrants | Uganda | 28.8 /100 | #190 | Fair 5.4% |
| Immigrants | South Eastern Asia | 28.2 /100 | #191 | Fair 5.4% |
| Immigrants | Belarus | 26.0 /100 | #192 | Fair 5.4% |
| Immigrants | Israel | 25.2 /100 | #193 | Fair 5.4% |
| Spanish | 19.7 /100 | #194 | Poor 5.4% |
| Immigrants | Southern Europe | 17.7 /100 | #195 | Poor 5.4% |
| Albanians | 17.3 /100 | #196 | Poor 5.4% |
| Alsatians | 16.7 /100 | #197 | Poor 5.4% |
Demographics Similar to Immigrants from Dominica by Male Unemployment
In terms of male unemployment, the demographic groups most similar to Immigrants from Dominica are Lumbee (6.9%, a difference of 1.0%), Immigrants from Armenia (6.9%, a difference of 1.2%), Immigrants from Barbados (7.1%, a difference of 1.3%), Houma (7.1%, a difference of 1.5%), and Immigrants from Guyana (7.1%, a difference of 1.5%).
| Demographics | Rating | Rank | Male Unemployment |
| Immigrants | Trinidad and Tobago | 0.0 /100 | #306 | Tragic 6.7% |
| Immigrants | Jamaica | 0.0 /100 | #307 | Tragic 6.7% |
| Aleuts | 0.0 /100 | #308 | Tragic 6.8% |
| Barbadians | 0.0 /100 | #309 | Tragic 6.9% |
| Blacks/African Americans | 0.0 /100 | #310 | Tragic 6.9% |
| Immigrants | Armenia | 0.0 /100 | #311 | Tragic 6.9% |
| Lumbee | 0.0 /100 | #312 | Tragic 6.9% |
| Immigrants | Dominica | 0.0 /100 | #313 | Tragic 7.0% |
| Immigrants | Barbados | 0.0 /100 | #314 | Tragic 7.1% |
| Houma | 0.0 /100 | #315 | Tragic 7.1% |
| Immigrants | Guyana | 0.0 /100 | #316 | Tragic 7.1% |
| Guyanese | 0.0 /100 | #317 | Tragic 7.1% |
| Cape Verdeans | 0.0 /100 | #318 | Tragic 7.1% |
| British West Indians | 0.0 /100 | #319 | Tragic 7.3% |
| Colville | 0.0 /100 | #320 | Tragic 7.4% |