Immigrants from Nigeria vs Honduran Unemployment Among Ages 16 to 19 years
COMPARE
Immigrants from Nigeria
Honduran
Unemployment Among Ages 16 to 19 years
Unemployment Among Ages 16 to 19 years Comparison
Immigrants from Nigeria
Hondurans
18.9%
UNEMPLOYMENT AMONG AGES 16 TO 19 YEARS
0.2/ 100
METRIC RATING
257th/ 347
METRIC RANK
19.2%
UNEMPLOYMENT AMONG AGES 16 TO 19 YEARS
0.1/ 100
METRIC RATING
270th/ 347
METRIC RANK
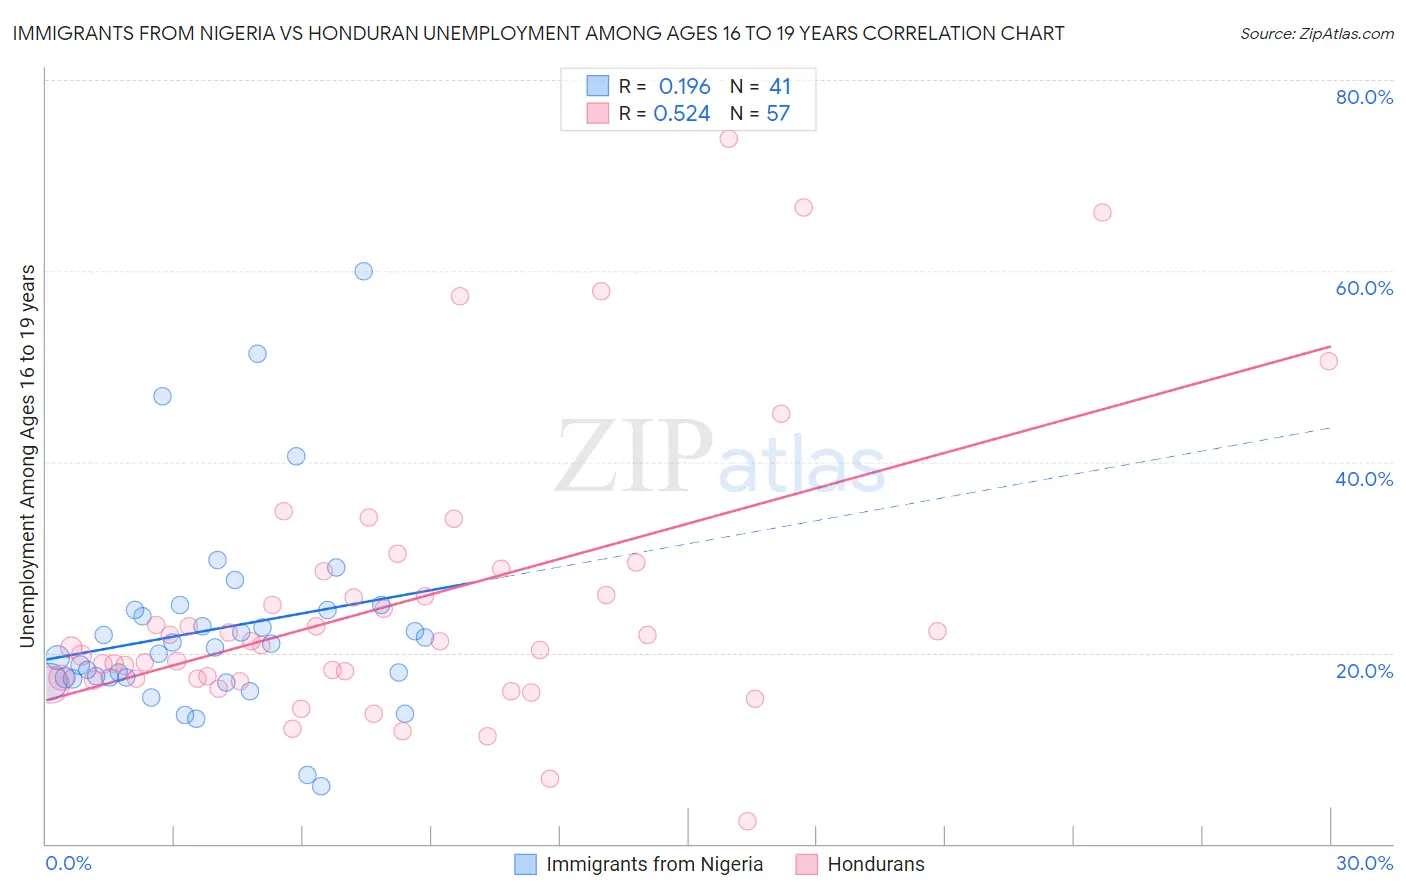
Immigrants from Nigeria vs Honduran Unemployment Among Ages 16 to 19 years Correlation Chart
The statistical analysis conducted on geographies consisting of 275,738,404 people shows a poor positive correlation between the proportion of Immigrants from Nigeria and unemployment rate among population between the ages 16 and 19 in the United States with a correlation coefficient (R) of 0.196 and weighted average of 18.9%. Similarly, the statistical analysis conducted on geographies consisting of 343,682,846 people shows a substantial positive correlation between the proportion of Hondurans and unemployment rate among population between the ages 16 and 19 in the United States with a correlation coefficient (R) of 0.524 and weighted average of 19.2%, a difference of 1.5%.
Unemployment Among Ages 16 to 19 years Correlation Summary
| Measurement | Immigrants from Nigeria | Honduran |
| Minimum | 6.0% | 2.3% |
| Maximum | 60.0% | 73.9% |
| Range | 54.0% | 71.6% |
| Mean | 22.5% | 25.1% |
| Median | 20.5% | 20.8% |
| Interquartile 25% (IQ1) | 17.3% | 17.2% |
| Interquartile 75% (IQ3) | 24.5% | 27.3% |
| Interquartile Range (IQR) | 7.2% | 10.1% |
| Standard Deviation (Sample) | 10.5% | 14.8% |
| Standard Deviation (Population) | 10.4% | 14.6% |
Demographics Similar to Immigrants from Nigeria and Hondurans by Unemployment Among Ages 16 to 19 years
In terms of unemployment among ages 16 to 19 years, the demographic groups most similar to Immigrants from Nigeria are Immigrants from Mexico (18.9%, a difference of 0.14%), Immigrants from Central America (18.9%, a difference of 0.22%), Mexican American Indian (18.8%, a difference of 0.26%), Nigerian (18.9%, a difference of 0.30%), and Immigrants from Cameroon (18.8%, a difference of 0.33%). Similarly, the demographic groups most similar to Hondurans are Lumbee (19.1%, a difference of 0.18%), Immigrants from El Salvador (19.1%, a difference of 0.26%), Blackfeet (19.2%, a difference of 0.38%), Hispanic or Latino (19.2%, a difference of 0.50%), and Israeli (19.0%, a difference of 0.54%).
| Demographics | Rating | Rank | Unemployment Among Ages 16 to 19 years |
| Central Americans | 0.3 /100 | #253 | Tragic 18.8% |
| Apache | 0.3 /100 | #254 | Tragic 18.8% |
| Immigrants | Cameroon | 0.3 /100 | #255 | Tragic 18.8% |
| Mexican American Indians | 0.3 /100 | #256 | Tragic 18.8% |
| Immigrants | Nigeria | 0.2 /100 | #257 | Tragic 18.9% |
| Immigrants | Mexico | 0.2 /100 | #258 | Tragic 18.9% |
| Immigrants | Central America | 0.2 /100 | #259 | Tragic 18.9% |
| Nigerians | 0.2 /100 | #260 | Tragic 18.9% |
| Spanish American Indians | 0.1 /100 | #261 | Tragic 18.9% |
| Salvadorans | 0.1 /100 | #262 | Tragic 18.9% |
| Cree | 0.1 /100 | #263 | Tragic 19.0% |
| Yaqui | 0.1 /100 | #264 | Tragic 19.0% |
| Choctaw | 0.1 /100 | #265 | Tragic 19.0% |
| Immigrants | Honduras | 0.1 /100 | #266 | Tragic 19.0% |
| Israelis | 0.1 /100 | #267 | Tragic 19.0% |
| Immigrants | El Salvador | 0.1 /100 | #268 | Tragic 19.1% |
| Lumbee | 0.1 /100 | #269 | Tragic 19.1% |
| Hondurans | 0.1 /100 | #270 | Tragic 19.2% |
| Blackfeet | 0.0 /100 | #271 | Tragic 19.2% |
| Hispanics or Latinos | 0.0 /100 | #272 | Tragic 19.2% |
| Immigrants | Panama | 0.0 /100 | #273 | Tragic 19.3% |