Immigrants from Turkey vs Haitian Male Unemployment
COMPARE
Immigrants from Turkey
Haitian
Male Unemployment
Male Unemployment Comparison
Immigrants from Turkey
Haitians
5.1%
MALE UNEMPLOYMENT
94.4/ 100
METRIC RATING
91st/ 347
METRIC RANK
6.4%
MALE UNEMPLOYMENT
0.0/ 100
METRIC RATING
293rd/ 347
METRIC RANK
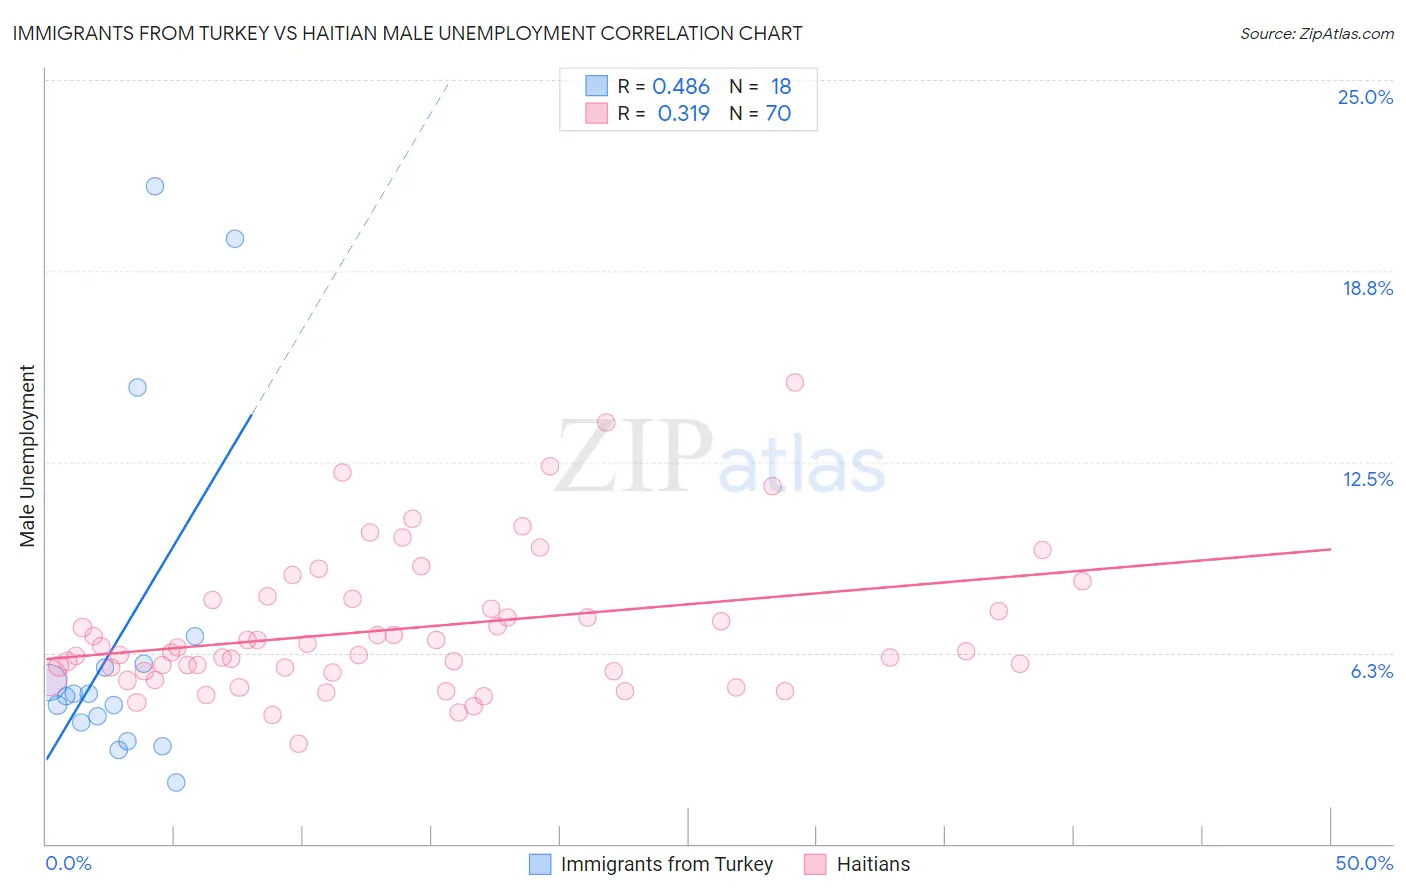
Immigrants from Turkey vs Haitian Male Unemployment Correlation Chart
The statistical analysis conducted on geographies consisting of 222,708,135 people shows a moderate positive correlation between the proportion of Immigrants from Turkey and unemployment rate among males in the United States with a correlation coefficient (R) of 0.486 and weighted average of 5.1%. Similarly, the statistical analysis conducted on geographies consisting of 287,158,450 people shows a mild positive correlation between the proportion of Haitians and unemployment rate among males in the United States with a correlation coefficient (R) of 0.319 and weighted average of 6.4%, a difference of 26.9%.
Male Unemployment Correlation Summary
| Measurement | Immigrants from Turkey | Haitian |
| Minimum | 2.0% | 3.3% |
| Maximum | 21.5% | 15.1% |
| Range | 19.5% | 11.8% |
| Mean | 6.9% | 7.0% |
| Median | 4.9% | 6.3% |
| Interquartile 25% (IQ1) | 4.0% | 5.7% |
| Interquartile 75% (IQ3) | 5.9% | 8.0% |
| Interquartile Range (IQR) | 1.9% | 2.3% |
| Standard Deviation (Sample) | 5.7% | 2.3% |
| Standard Deviation (Population) | 5.5% | 2.3% |
Similar Demographics by Male Unemployment
Demographics Similar to Immigrants from Turkey by Male Unemployment
In terms of male unemployment, the demographic groups most similar to Immigrants from Turkey are Slavic (5.1%, a difference of 0.060%), Immigrants from Serbia (5.1%, a difference of 0.060%), Okinawan (5.1%, a difference of 0.080%), Immigrants from Australia (5.1%, a difference of 0.090%), and Canadian (5.1%, a difference of 0.10%).
| Demographics | Rating | Rank | Male Unemployment |
| Serbians | 95.7 /100 | #84 | Exceptional 5.1% |
| Immigrants | North Macedonia | 95.6 /100 | #85 | Exceptional 5.1% |
| Maltese | 95.5 /100 | #86 | Exceptional 5.1% |
| Immigrants | Romania | 95.4 /100 | #87 | Exceptional 5.1% |
| Immigrants | Sri Lanka | 94.9 /100 | #88 | Exceptional 5.1% |
| Immigrants | Australia | 94.7 /100 | #89 | Exceptional 5.1% |
| Okinawans | 94.7 /100 | #90 | Exceptional 5.1% |
| Immigrants | Turkey | 94.4 /100 | #91 | Exceptional 5.1% |
| Slavs | 94.2 /100 | #92 | Exceptional 5.1% |
| Immigrants | Serbia | 94.2 /100 | #93 | Exceptional 5.1% |
| Canadians | 94.1 /100 | #94 | Exceptional 5.1% |
| Italians | 93.8 /100 | #95 | Exceptional 5.1% |
| Asians | 93.7 /100 | #96 | Exceptional 5.1% |
| Immigrants | Spain | 93.4 /100 | #97 | Exceptional 5.1% |
| Immigrants | Kuwait | 93.3 /100 | #98 | Exceptional 5.1% |
Demographics Similar to Haitians by Male Unemployment
In terms of male unemployment, the demographic groups most similar to Haitians are Nepalese (6.4%, a difference of 0.030%), Senegalese (6.4%, a difference of 0.11%), Immigrants from the Azores (6.4%, a difference of 0.38%), U.S. Virgin Islander (6.4%, a difference of 0.90%), and Belizean (6.5%, a difference of 0.96%).
| Demographics | Rating | Rank | Male Unemployment |
| Africans | 0.0 /100 | #286 | Tragic 6.3% |
| Central American Indians | 0.0 /100 | #287 | Tragic 6.3% |
| Immigrants | Senegal | 0.0 /100 | #288 | Tragic 6.3% |
| Immigrants | Caribbean | 0.0 /100 | #289 | Tragic 6.3% |
| U.S. Virgin Islanders | 0.0 /100 | #290 | Tragic 6.4% |
| Immigrants | Azores | 0.0 /100 | #291 | Tragic 6.4% |
| Nepalese | 0.0 /100 | #292 | Tragic 6.4% |
| Haitians | 0.0 /100 | #293 | Tragic 6.4% |
| Senegalese | 0.0 /100 | #294 | Tragic 6.4% |
| Belizeans | 0.0 /100 | #295 | Tragic 6.5% |
| Immigrants | Haiti | 0.0 /100 | #296 | Tragic 6.5% |
| Chippewa | 0.0 /100 | #297 | Tragic 6.6% |
| Jamaicans | 0.0 /100 | #298 | Tragic 6.6% |
| Immigrants | Bangladesh | 0.0 /100 | #299 | Tragic 6.6% |
| Vietnamese | 0.0 /100 | #300 | Tragic 6.6% |