Immigrants from Turkey vs Comanche Male Unemployment
COMPARE
Immigrants from Turkey
Comanche
Male Unemployment
Male Unemployment Comparison
Immigrants from Turkey
Comanche
5.1%
MALE UNEMPLOYMENT
94.4/ 100
METRIC RATING
91st/ 347
METRIC RANK
5.8%
MALE UNEMPLOYMENT
0.2/ 100
METRIC RATING
256th/ 347
METRIC RANK
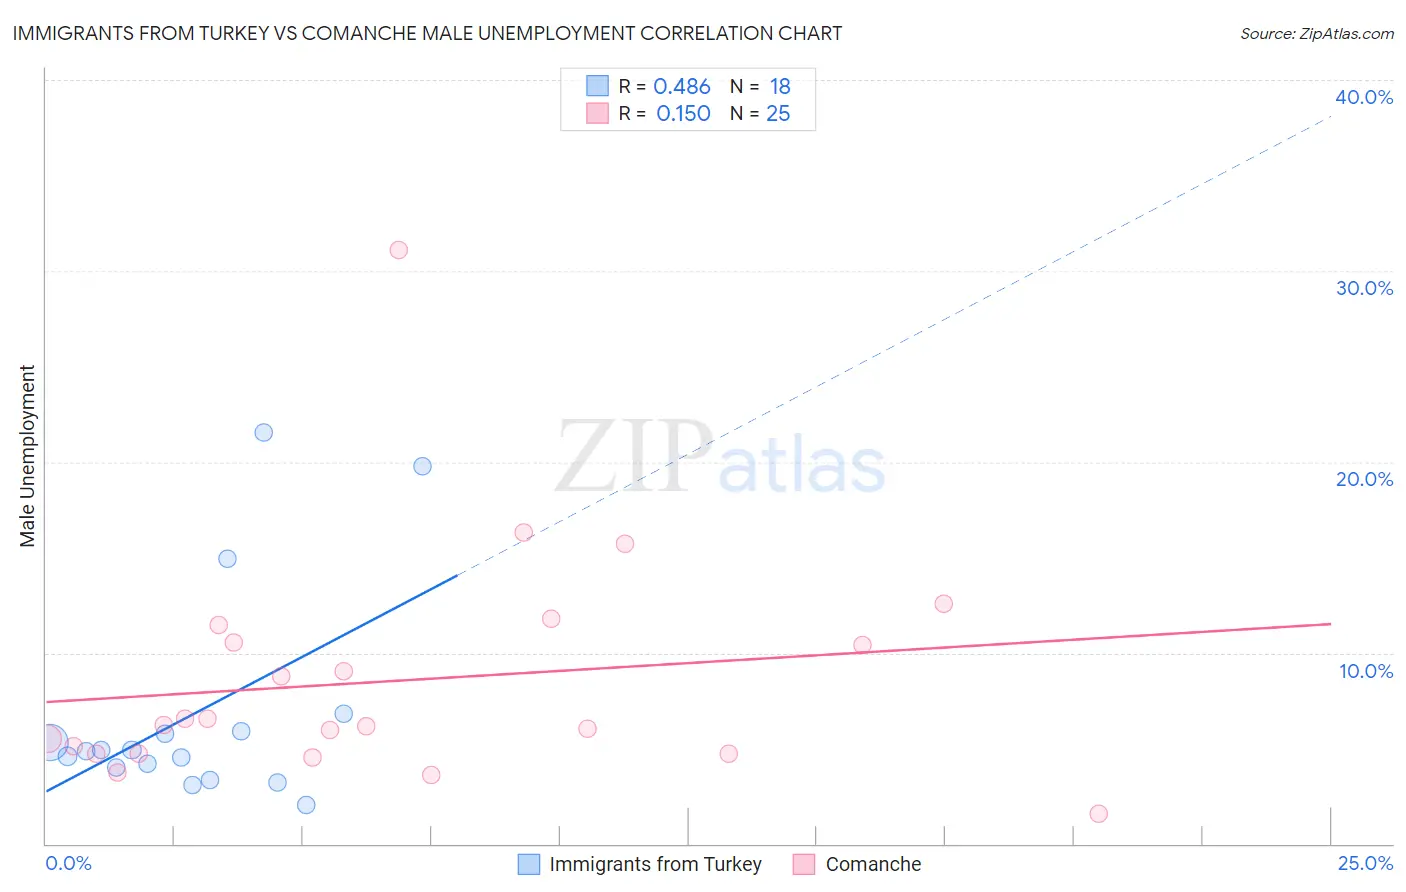
Immigrants from Turkey vs Comanche Male Unemployment Correlation Chart
The statistical analysis conducted on geographies consisting of 222,708,135 people shows a moderate positive correlation between the proportion of Immigrants from Turkey and unemployment rate among males in the United States with a correlation coefficient (R) of 0.486 and weighted average of 5.1%. Similarly, the statistical analysis conducted on geographies consisting of 109,543,085 people shows a poor positive correlation between the proportion of Comanche and unemployment rate among males in the United States with a correlation coefficient (R) of 0.150 and weighted average of 5.8%, a difference of 14.1%.
Male Unemployment Correlation Summary
| Measurement | Immigrants from Turkey | Comanche |
| Minimum | 2.0% | 1.6% |
| Maximum | 21.5% | 31.1% |
| Range | 19.5% | 29.5% |
| Mean | 6.9% | 8.5% |
| Median | 4.9% | 6.2% |
| Interquartile 25% (IQ1) | 4.0% | 4.7% |
| Interquartile 75% (IQ3) | 5.9% | 11.0% |
| Interquartile Range (IQR) | 1.9% | 6.3% |
| Standard Deviation (Sample) | 5.7% | 6.0% |
| Standard Deviation (Population) | 5.5% | 5.9% |
Similar Demographics by Male Unemployment
Demographics Similar to Immigrants from Turkey by Male Unemployment
In terms of male unemployment, the demographic groups most similar to Immigrants from Turkey are Slavic (5.1%, a difference of 0.060%), Immigrants from Serbia (5.1%, a difference of 0.060%), Okinawan (5.1%, a difference of 0.080%), Immigrants from Australia (5.1%, a difference of 0.090%), and Canadian (5.1%, a difference of 0.10%).
| Demographics | Rating | Rank | Male Unemployment |
| Serbians | 95.7 /100 | #84 | Exceptional 5.1% |
| Immigrants | North Macedonia | 95.6 /100 | #85 | Exceptional 5.1% |
| Maltese | 95.5 /100 | #86 | Exceptional 5.1% |
| Immigrants | Romania | 95.4 /100 | #87 | Exceptional 5.1% |
| Immigrants | Sri Lanka | 94.9 /100 | #88 | Exceptional 5.1% |
| Immigrants | Australia | 94.7 /100 | #89 | Exceptional 5.1% |
| Okinawans | 94.7 /100 | #90 | Exceptional 5.1% |
| Immigrants | Turkey | 94.4 /100 | #91 | Exceptional 5.1% |
| Slavs | 94.2 /100 | #92 | Exceptional 5.1% |
| Immigrants | Serbia | 94.2 /100 | #93 | Exceptional 5.1% |
| Canadians | 94.1 /100 | #94 | Exceptional 5.1% |
| Italians | 93.8 /100 | #95 | Exceptional 5.1% |
| Asians | 93.7 /100 | #96 | Exceptional 5.1% |
| Immigrants | Spain | 93.4 /100 | #97 | Exceptional 5.1% |
| Immigrants | Kuwait | 93.3 /100 | #98 | Exceptional 5.1% |
Demographics Similar to Comanche by Male Unemployment
In terms of male unemployment, the demographic groups most similar to Comanche are Kiowa (5.8%, a difference of 0.080%), Hispanic or Latino (5.8%, a difference of 0.17%), Japanese (5.8%, a difference of 0.18%), Dutch West Indian (5.8%, a difference of 0.30%), and Mexican American Indian (5.8%, a difference of 0.35%).
| Demographics | Rating | Rank | Male Unemployment |
| Cree | 0.4 /100 | #249 | Tragic 5.7% |
| Immigrants | Bahamas | 0.4 /100 | #250 | Tragic 5.7% |
| Spanish Americans | 0.3 /100 | #251 | Tragic 5.7% |
| Mexicans | 0.2 /100 | #252 | Tragic 5.8% |
| Mexican American Indians | 0.2 /100 | #253 | Tragic 5.8% |
| Japanese | 0.2 /100 | #254 | Tragic 5.8% |
| Kiowa | 0.2 /100 | #255 | Tragic 5.8% |
| Comanche | 0.2 /100 | #256 | Tragic 5.8% |
| Hispanics or Latinos | 0.1 /100 | #257 | Tragic 5.8% |
| Dutch West Indians | 0.1 /100 | #258 | Tragic 5.8% |
| Cajuns | 0.1 /100 | #259 | Tragic 5.8% |
| Immigrants | Central America | 0.1 /100 | #260 | Tragic 5.8% |
| Liberians | 0.1 /100 | #261 | Tragic 5.8% |
| Immigrants | Portugal | 0.1 /100 | #262 | Tragic 5.9% |
| Immigrants | Latin America | 0.1 /100 | #263 | Tragic 5.9% |