Immigrants from Turkey vs Fijian Unemployment Among Ages 55 to 59 years
COMPARE
Immigrants from Turkey
Fijian
Unemployment Among Ages 55 to 59 years
Unemployment Among Ages 55 to 59 years Comparison
Immigrants from Turkey
Fijians
4.7%
UNEMPLOYMENT AMONG AGES 55 TO 59 YEARS
93.9/ 100
METRIC RATING
104th/ 347
METRIC RANK
4.1%
UNEMPLOYMENT AMONG AGES 55 TO 59 YEARS
100.0/ 100
METRIC RATING
1st/ 347
METRIC RANK
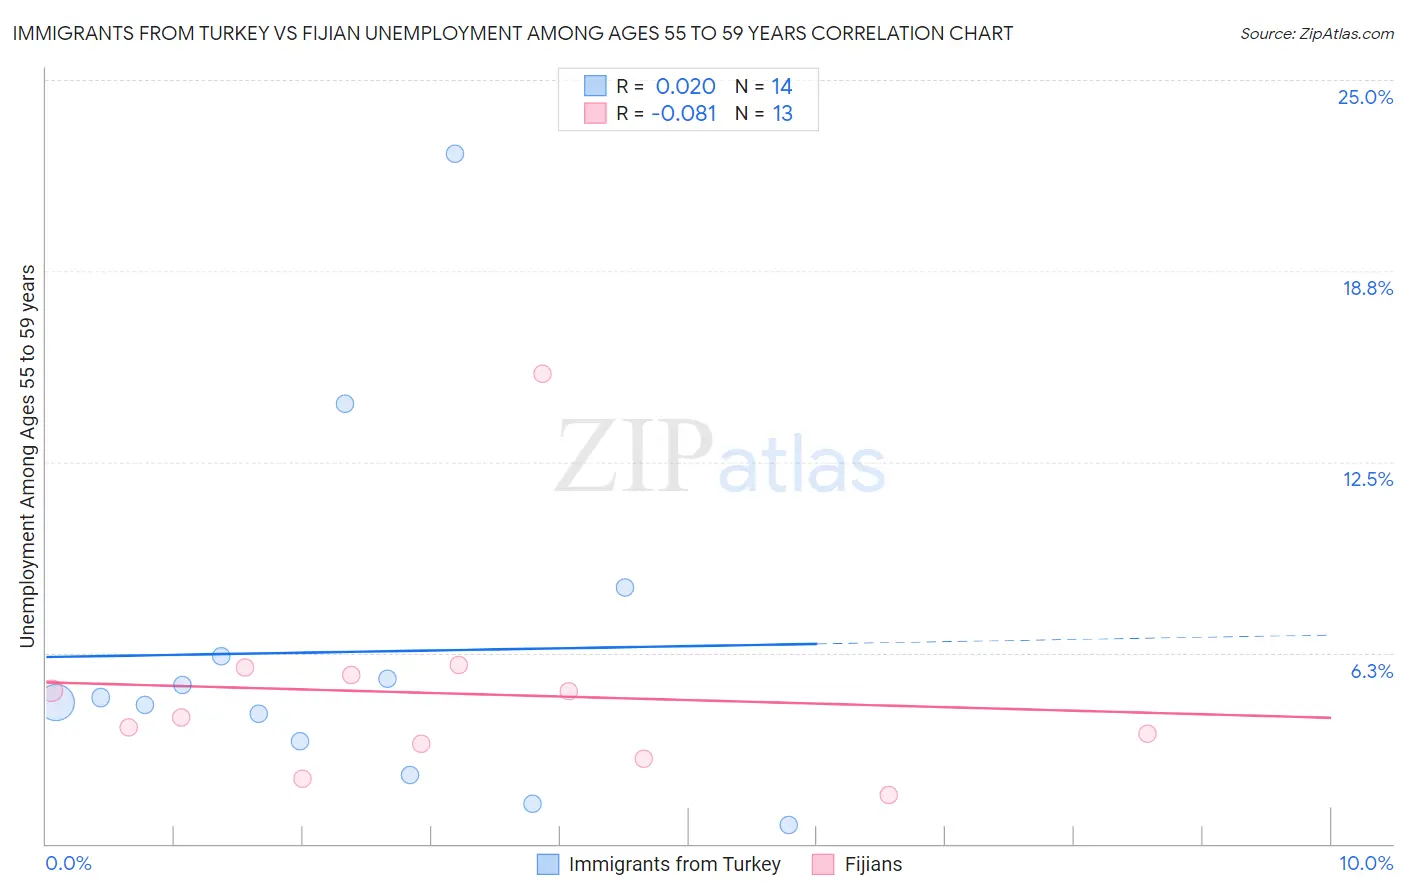
Immigrants from Turkey vs Fijian Unemployment Among Ages 55 to 59 years Correlation Chart
The statistical analysis conducted on geographies consisting of 214,841,701 people shows no correlation between the proportion of Immigrants from Turkey and unemployment rate among population between the ages 55 and 59 in the United States with a correlation coefficient (R) of 0.020 and weighted average of 4.7%. Similarly, the statistical analysis conducted on geographies consisting of 54,580,440 people shows a slight negative correlation between the proportion of Fijians and unemployment rate among population between the ages 55 and 59 in the United States with a correlation coefficient (R) of -0.081 and weighted average of 4.1%, a difference of 15.1%.
Unemployment Among Ages 55 to 59 years Correlation Summary
| Measurement | Immigrants from Turkey | Fijian |
| Minimum | 0.60% | 1.6% |
| Maximum | 22.6% | 15.4% |
| Range | 22.0% | 13.8% |
| Mean | 6.3% | 4.9% |
| Median | 4.7% | 4.1% |
| Interquartile 25% (IQ1) | 3.4% | 3.0% |
| Interquartile 75% (IQ3) | 6.1% | 5.6% |
| Interquartile Range (IQR) | 2.8% | 2.6% |
| Standard Deviation (Sample) | 5.8% | 3.4% |
| Standard Deviation (Population) | 5.6% | 3.3% |
Similar Demographics by Unemployment Among Ages 55 to 59 years
Demographics Similar to Immigrants from Turkey by Unemployment Among Ages 55 to 59 years
In terms of unemployment among ages 55 to 59 years, the demographic groups most similar to Immigrants from Turkey are Immigrants from North America (4.7%, a difference of 0.010%), Canadian (4.7%, a difference of 0.020%), Immigrants from Oceania (4.7%, a difference of 0.020%), Immigrants from Laos (4.7%, a difference of 0.020%), and Celtic (4.7%, a difference of 0.070%).
| Demographics | Rating | Rank | Unemployment Among Ages 55 to 59 years |
| Immigrants | Canada | 94.9 /100 | #97 | Exceptional 4.7% |
| Immigrants | Germany | 94.8 /100 | #98 | Exceptional 4.7% |
| Yugoslavians | 94.7 /100 | #99 | Exceptional 4.7% |
| Serbians | 94.4 /100 | #100 | Exceptional 4.7% |
| Celtics | 94.3 /100 | #101 | Exceptional 4.7% |
| Canadians | 94.1 /100 | #102 | Exceptional 4.7% |
| Immigrants | Oceania | 94.0 /100 | #103 | Exceptional 4.7% |
| Immigrants | Turkey | 93.9 /100 | #104 | Exceptional 4.7% |
| Immigrants | North America | 93.9 /100 | #105 | Exceptional 4.7% |
| Immigrants | Laos | 93.9 /100 | #106 | Exceptional 4.7% |
| Immigrants | Egypt | 93.5 /100 | #107 | Exceptional 4.7% |
| French | 93.3 /100 | #108 | Exceptional 4.7% |
| Chileans | 93.2 /100 | #109 | Exceptional 4.7% |
| Egyptians | 92.9 /100 | #110 | Exceptional 4.7% |
| Austrians | 92.4 /100 | #111 | Exceptional 4.7% |
Demographics Similar to Fijians by Unemployment Among Ages 55 to 59 years
In terms of unemployment among ages 55 to 59 years, the demographic groups most similar to Fijians are Immigrants from Cuba (4.1%, a difference of 0.31%), Immigrants from Venezuela (4.1%, a difference of 0.31%), Venezuelan (4.2%, a difference of 2.2%), Immigrants from Bolivia (4.2%, a difference of 2.8%), and Norwegian (4.2%, a difference of 3.4%).
| Demographics | Rating | Rank | Unemployment Among Ages 55 to 59 years |
| Fijians | 100.0 /100 | #1 | Exceptional 4.1% |
| Immigrants | Cuba | 100.0 /100 | #2 | Exceptional 4.1% |
| Immigrants | Venezuela | 100.0 /100 | #3 | Exceptional 4.1% |
| Venezuelans | 100.0 /100 | #4 | Exceptional 4.2% |
| Immigrants | Bolivia | 100.0 /100 | #5 | Exceptional 4.2% |
| Norwegians | 100.0 /100 | #6 | Exceptional 4.2% |
| Zimbabweans | 100.0 /100 | #7 | Exceptional 4.2% |
| Bolivians | 100.0 /100 | #8 | Exceptional 4.2% |
| Cubans | 100.0 /100 | #9 | Exceptional 4.2% |
| Tongans | 100.0 /100 | #10 | Exceptional 4.3% |
| Immigrants | Congo | 100.0 /100 | #11 | Exceptional 4.3% |
| Danes | 100.0 /100 | #12 | Exceptional 4.3% |
| Indonesians | 100.0 /100 | #13 | Exceptional 4.3% |
| Immigrants | India | 100.0 /100 | #14 | Exceptional 4.3% |
| Bulgarians | 100.0 /100 | #15 | Exceptional 4.3% |