British West Indian vs Haitian Male Unemployment
COMPARE
British West Indian
Haitian
Male Unemployment
Male Unemployment Comparison
British West Indians
Haitians
7.3%
MALE UNEMPLOYMENT
0.0/ 100
METRIC RATING
319th/ 347
METRIC RANK
6.4%
MALE UNEMPLOYMENT
0.0/ 100
METRIC RATING
293rd/ 347
METRIC RANK
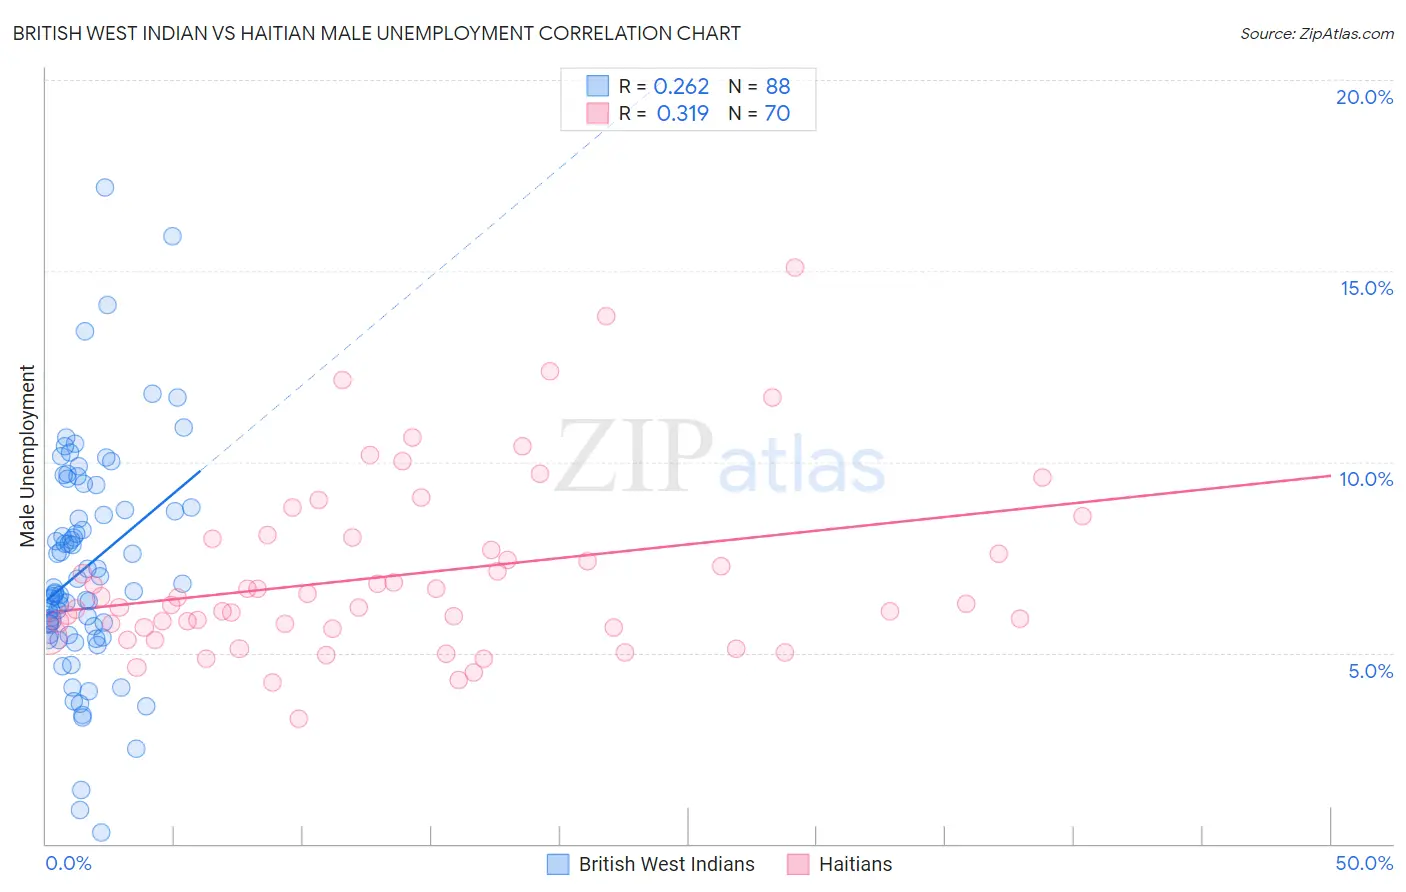
British West Indian vs Haitian Male Unemployment Correlation Chart
The statistical analysis conducted on geographies consisting of 152,492,993 people shows a weak positive correlation between the proportion of British West Indians and unemployment rate among males in the United States with a correlation coefficient (R) of 0.262 and weighted average of 7.3%. Similarly, the statistical analysis conducted on geographies consisting of 287,158,450 people shows a mild positive correlation between the proportion of Haitians and unemployment rate among males in the United States with a correlation coefficient (R) of 0.319 and weighted average of 6.4%, a difference of 13.4%.
Male Unemployment Correlation Summary
| Measurement | British West Indian | Haitian |
| Minimum | 0.30% | 3.3% |
| Maximum | 17.2% | 15.1% |
| Range | 16.9% | 11.8% |
| Mean | 7.2% | 7.0% |
| Median | 6.7% | 6.3% |
| Interquartile 25% (IQ1) | 5.6% | 5.7% |
| Interquartile 75% (IQ3) | 8.8% | 8.0% |
| Interquartile Range (IQR) | 3.2% | 2.3% |
| Standard Deviation (Sample) | 2.9% | 2.3% |
| Standard Deviation (Population) | 2.9% | 2.3% |
Similar Demographics by Male Unemployment
Demographics Similar to British West Indians by Male Unemployment
In terms of male unemployment, the demographic groups most similar to British West Indians are Colville (7.4%, a difference of 0.90%), Immigrants from St. Vincent and the Grenadines (7.5%, a difference of 2.3%), Cape Verdean (7.1%, a difference of 2.5%), Immigrants from Cabo Verde (7.5%, a difference of 2.6%), and Guyanese (7.1%, a difference of 2.6%).
| Demographics | Rating | Rank | Male Unemployment |
| Lumbee | 0.0 /100 | #312 | Tragic 6.9% |
| Immigrants | Dominica | 0.0 /100 | #313 | Tragic 7.0% |
| Immigrants | Barbados | 0.0 /100 | #314 | Tragic 7.1% |
| Houma | 0.0 /100 | #315 | Tragic 7.1% |
| Immigrants | Guyana | 0.0 /100 | #316 | Tragic 7.1% |
| Guyanese | 0.0 /100 | #317 | Tragic 7.1% |
| Cape Verdeans | 0.0 /100 | #318 | Tragic 7.1% |
| British West Indians | 0.0 /100 | #319 | Tragic 7.3% |
| Colville | 0.0 /100 | #320 | Tragic 7.4% |
| Immigrants | St. Vincent and the Grenadines | 0.0 /100 | #321 | Tragic 7.5% |
| Immigrants | Cabo Verde | 0.0 /100 | #322 | Tragic 7.5% |
| Immigrants | Grenada | 0.0 /100 | #323 | Tragic 7.6% |
| Dominicans | 0.0 /100 | #324 | Tragic 7.6% |
| Shoshone | 0.0 /100 | #325 | Tragic 7.6% |
| Immigrants | Dominican Republic | 0.0 /100 | #326 | Tragic 7.6% |
Demographics Similar to Haitians by Male Unemployment
In terms of male unemployment, the demographic groups most similar to Haitians are Nepalese (6.4%, a difference of 0.030%), Senegalese (6.4%, a difference of 0.11%), Immigrants from the Azores (6.4%, a difference of 0.38%), U.S. Virgin Islander (6.4%, a difference of 0.90%), and Belizean (6.5%, a difference of 0.96%).
| Demographics | Rating | Rank | Male Unemployment |
| Africans | 0.0 /100 | #286 | Tragic 6.3% |
| Central American Indians | 0.0 /100 | #287 | Tragic 6.3% |
| Immigrants | Senegal | 0.0 /100 | #288 | Tragic 6.3% |
| Immigrants | Caribbean | 0.0 /100 | #289 | Tragic 6.3% |
| U.S. Virgin Islanders | 0.0 /100 | #290 | Tragic 6.4% |
| Immigrants | Azores | 0.0 /100 | #291 | Tragic 6.4% |
| Nepalese | 0.0 /100 | #292 | Tragic 6.4% |
| Haitians | 0.0 /100 | #293 | Tragic 6.4% |
| Senegalese | 0.0 /100 | #294 | Tragic 6.4% |
| Belizeans | 0.0 /100 | #295 | Tragic 6.5% |
| Immigrants | Haiti | 0.0 /100 | #296 | Tragic 6.5% |
| Chippewa | 0.0 /100 | #297 | Tragic 6.6% |
| Jamaicans | 0.0 /100 | #298 | Tragic 6.6% |
| Immigrants | Bangladesh | 0.0 /100 | #299 | Tragic 6.6% |
| Vietnamese | 0.0 /100 | #300 | Tragic 6.6% |