Immigrants from Kenya vs Haitian Male Unemployment
COMPARE
Immigrants from Kenya
Haitian
Male Unemployment
Male Unemployment Comparison
Immigrants from Kenya
Haitians
5.2%
MALE UNEMPLOYMENT
77.6/ 100
METRIC RATING
146th/ 347
METRIC RANK
6.4%
MALE UNEMPLOYMENT
0.0/ 100
METRIC RATING
293rd/ 347
METRIC RANK
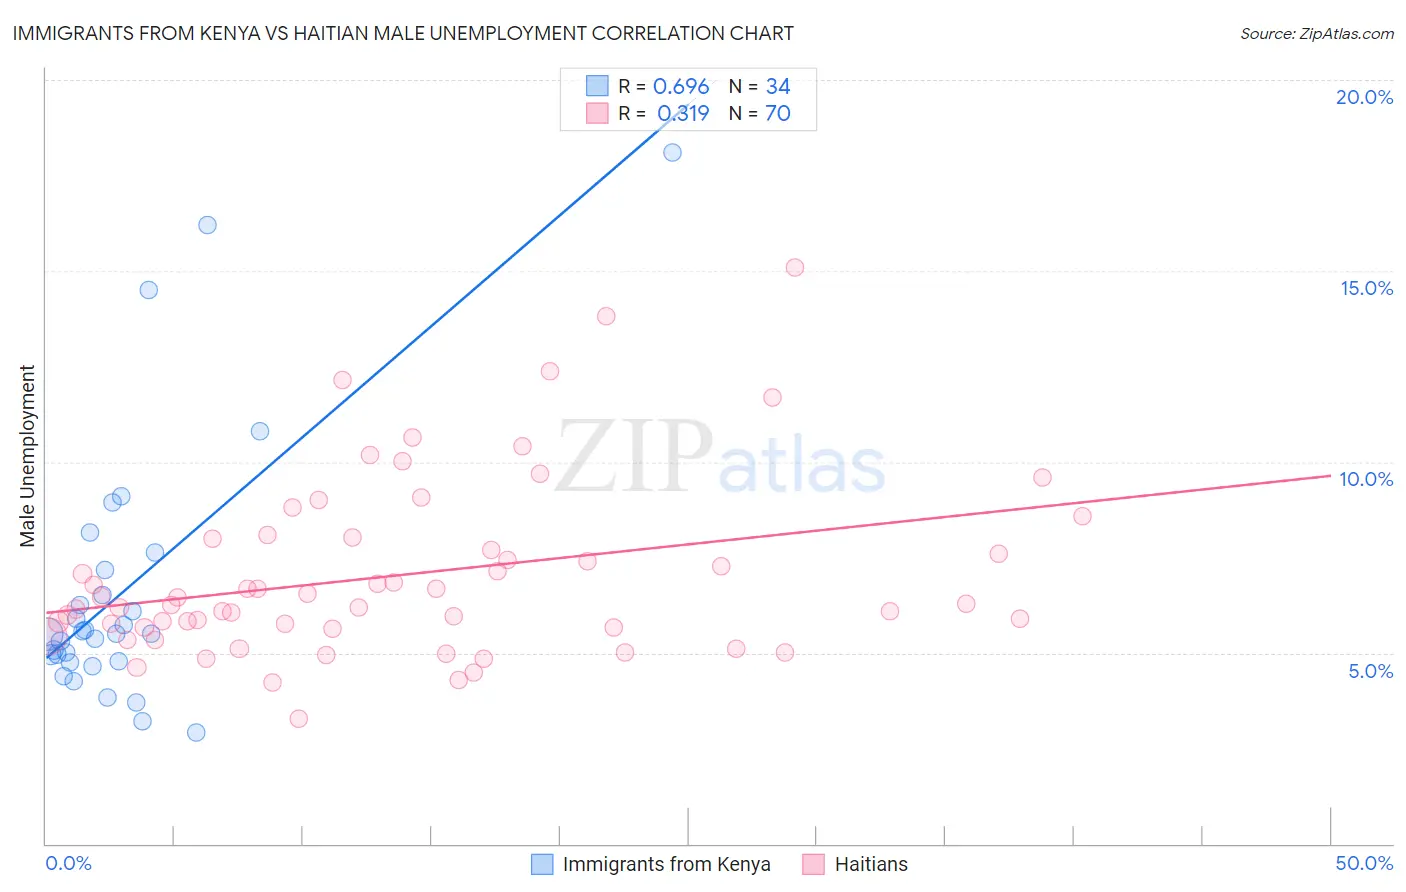
Immigrants from Kenya vs Haitian Male Unemployment Correlation Chart
The statistical analysis conducted on geographies consisting of 217,767,136 people shows a significant positive correlation between the proportion of Immigrants from Kenya and unemployment rate among males in the United States with a correlation coefficient (R) of 0.696 and weighted average of 5.2%. Similarly, the statistical analysis conducted on geographies consisting of 287,158,450 people shows a mild positive correlation between the proportion of Haitians and unemployment rate among males in the United States with a correlation coefficient (R) of 0.319 and weighted average of 6.4%, a difference of 23.9%.
Male Unemployment Correlation Summary
| Measurement | Immigrants from Kenya | Haitian |
| Minimum | 2.9% | 3.3% |
| Maximum | 18.1% | 15.1% |
| Range | 15.2% | 11.8% |
| Mean | 6.6% | 7.0% |
| Median | 5.5% | 6.3% |
| Interquartile 25% (IQ1) | 4.8% | 5.7% |
| Interquartile 75% (IQ3) | 7.2% | 8.0% |
| Interquartile Range (IQR) | 2.4% | 2.3% |
| Standard Deviation (Sample) | 3.5% | 2.3% |
| Standard Deviation (Population) | 3.4% | 2.3% |
Similar Demographics by Male Unemployment
Demographics Similar to Immigrants from Kenya by Male Unemployment
In terms of male unemployment, the demographic groups most similar to Immigrants from Kenya are Macedonian (5.2%, a difference of 0.010%), Immigrants from Burma/Myanmar (5.2%, a difference of 0.010%), Sri Lankan (5.2%, a difference of 0.020%), Syrian (5.2%, a difference of 0.030%), and Fijian (5.2%, a difference of 0.050%).
| Demographics | Rating | Rank | Male Unemployment |
| Kenyans | 79.4 /100 | #139 | Good 5.2% |
| Brazilians | 79.3 /100 | #140 | Good 5.2% |
| Immigrants | Switzerland | 79.2 /100 | #141 | Good 5.2% |
| Fijians | 78.3 /100 | #142 | Good 5.2% |
| Syrians | 78.0 /100 | #143 | Good 5.2% |
| Sri Lankans | 77.9 /100 | #144 | Good 5.2% |
| Macedonians | 77.7 /100 | #145 | Good 5.2% |
| Immigrants | Kenya | 77.6 /100 | #146 | Good 5.2% |
| Immigrants | Burma/Myanmar | 77.5 /100 | #147 | Good 5.2% |
| Immigrants | Italy | 76.3 /100 | #148 | Good 5.2% |
| Immigrants | Europe | 76.2 /100 | #149 | Good 5.2% |
| Indians (Asian) | 76.0 /100 | #150 | Good 5.2% |
| Slovaks | 75.5 /100 | #151 | Good 5.2% |
| Egyptians | 74.8 /100 | #152 | Good 5.2% |
| Immigrants | Uruguay | 73.9 /100 | #153 | Good 5.2% |
Demographics Similar to Haitians by Male Unemployment
In terms of male unemployment, the demographic groups most similar to Haitians are Nepalese (6.4%, a difference of 0.030%), Senegalese (6.4%, a difference of 0.11%), Immigrants from the Azores (6.4%, a difference of 0.38%), U.S. Virgin Islander (6.4%, a difference of 0.90%), and Belizean (6.5%, a difference of 0.96%).
| Demographics | Rating | Rank | Male Unemployment |
| Africans | 0.0 /100 | #286 | Tragic 6.3% |
| Central American Indians | 0.0 /100 | #287 | Tragic 6.3% |
| Immigrants | Senegal | 0.0 /100 | #288 | Tragic 6.3% |
| Immigrants | Caribbean | 0.0 /100 | #289 | Tragic 6.3% |
| U.S. Virgin Islanders | 0.0 /100 | #290 | Tragic 6.4% |
| Immigrants | Azores | 0.0 /100 | #291 | Tragic 6.4% |
| Nepalese | 0.0 /100 | #292 | Tragic 6.4% |
| Haitians | 0.0 /100 | #293 | Tragic 6.4% |
| Senegalese | 0.0 /100 | #294 | Tragic 6.4% |
| Belizeans | 0.0 /100 | #295 | Tragic 6.5% |
| Immigrants | Haiti | 0.0 /100 | #296 | Tragic 6.5% |
| Chippewa | 0.0 /100 | #297 | Tragic 6.6% |
| Jamaicans | 0.0 /100 | #298 | Tragic 6.6% |
| Immigrants | Bangladesh | 0.0 /100 | #299 | Tragic 6.6% |
| Vietnamese | 0.0 /100 | #300 | Tragic 6.6% |