Immigrants from Taiwan vs Paiute Unemployment Among Ages 55 to 59 years
COMPARE
Immigrants from Taiwan
Paiute
Unemployment Among Ages 55 to 59 years
Unemployment Among Ages 55 to 59 years Comparison
Immigrants from Taiwan
Paiute
4.6%
UNEMPLOYMENT AMONG AGES 55 TO 59 YEARS
98.7/ 100
METRIC RATING
72nd/ 347
METRIC RANK
6.8%
UNEMPLOYMENT AMONG AGES 55 TO 59 YEARS
0.0/ 100
METRIC RATING
337th/ 347
METRIC RANK
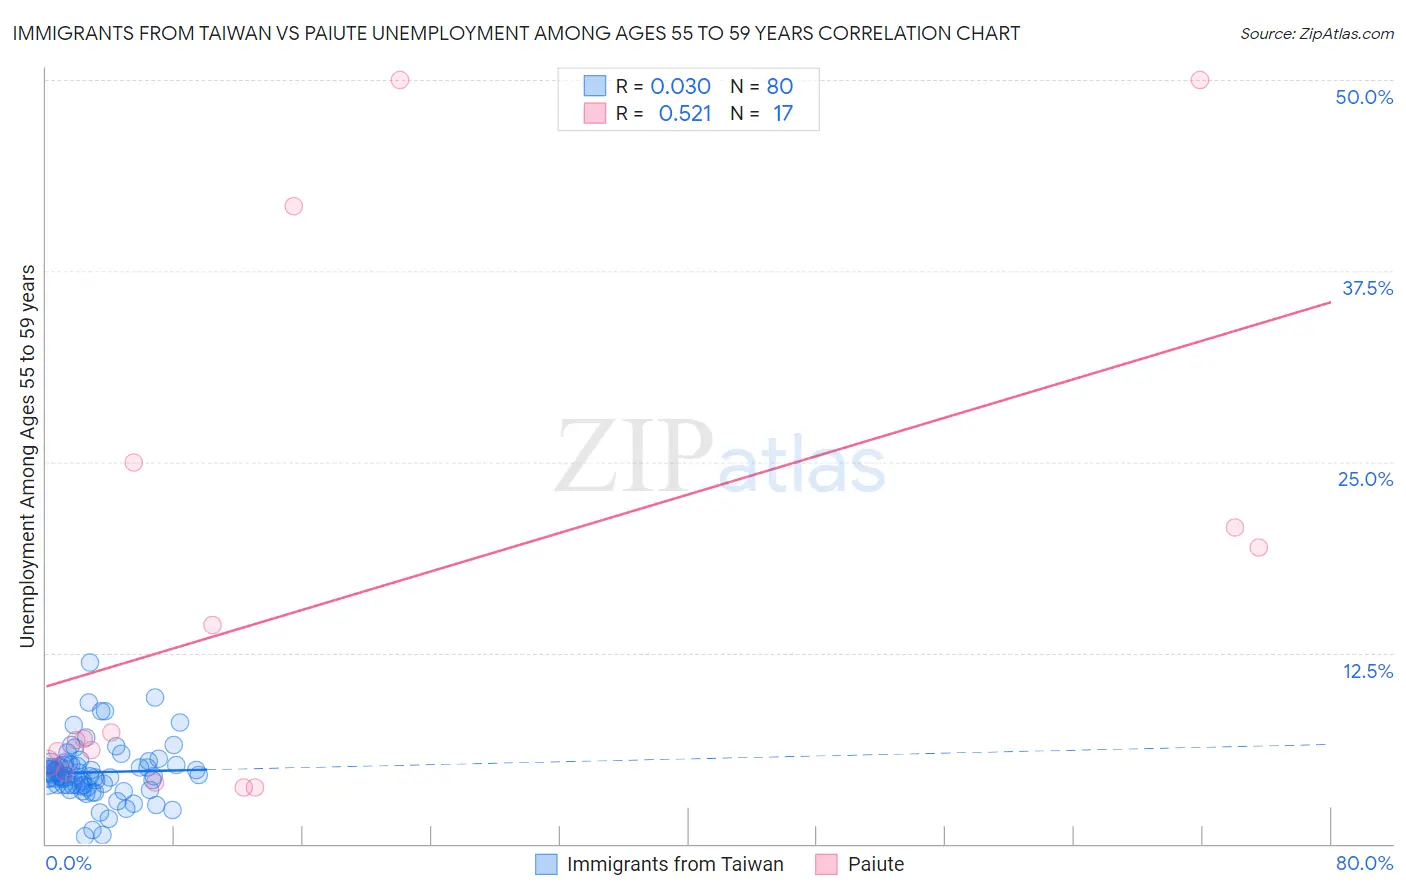
Immigrants from Taiwan vs Paiute Unemployment Among Ages 55 to 59 years Correlation Chart
The statistical analysis conducted on geographies consisting of 284,192,072 people shows no correlation between the proportion of Immigrants from Taiwan and unemployment rate among population between the ages 55 and 59 in the United States with a correlation coefficient (R) of 0.030 and weighted average of 4.6%. Similarly, the statistical analysis conducted on geographies consisting of 57,126,693 people shows a substantial positive correlation between the proportion of Paiute and unemployment rate among population between the ages 55 and 59 in the United States with a correlation coefficient (R) of 0.521 and weighted average of 6.8%, a difference of 46.7%.
Unemployment Among Ages 55 to 59 years Correlation Summary
| Measurement | Immigrants from Taiwan | Paiute |
| Minimum | 0.50% | 3.7% |
| Maximum | 11.9% | 50.0% |
| Range | 11.4% | 46.3% |
| Mean | 4.7% | 16.2% |
| Median | 4.5% | 6.9% |
| Interquartile 25% (IQ1) | 3.8% | 5.0% |
| Interquartile 75% (IQ3) | 5.2% | 22.9% |
| Interquartile Range (IQR) | 1.4% | 17.9% |
| Standard Deviation (Sample) | 1.9% | 16.2% |
| Standard Deviation (Population) | 1.9% | 15.8% |
Similar Demographics by Unemployment Among Ages 55 to 59 years
Demographics Similar to Immigrants from Taiwan by Unemployment Among Ages 55 to 59 years
In terms of unemployment among ages 55 to 59 years, the demographic groups most similar to Immigrants from Taiwan are Immigrants from Jordan (4.6%, a difference of 0.040%), Filipino (4.6%, a difference of 0.070%), Bhutanese (4.6%, a difference of 0.080%), Croatian (4.6%, a difference of 0.15%), and Immigrants from Iraq (4.6%, a difference of 0.17%).
| Demographics | Rating | Rank | Unemployment Among Ages 55 to 59 years |
| Sudanese | 99.1 /100 | #65 | Exceptional 4.6% |
| Mongolians | 99.0 /100 | #66 | Exceptional 4.6% |
| Ugandans | 99.0 /100 | #67 | Exceptional 4.6% |
| Immigrants | Micronesia | 99.0 /100 | #68 | Exceptional 4.6% |
| Czechoslovakians | 99.0 /100 | #69 | Exceptional 4.6% |
| Filipinos | 98.8 /100 | #70 | Exceptional 4.6% |
| Immigrants | Jordan | 98.7 /100 | #71 | Exceptional 4.6% |
| Immigrants | Taiwan | 98.7 /100 | #72 | Exceptional 4.6% |
| Bhutanese | 98.6 /100 | #73 | Exceptional 4.6% |
| Croatians | 98.5 /100 | #74 | Exceptional 4.6% |
| Immigrants | Iraq | 98.5 /100 | #75 | Exceptional 4.6% |
| Immigrants | Bosnia and Herzegovina | 98.3 /100 | #76 | Exceptional 4.6% |
| Scotch-Irish | 98.3 /100 | #77 | Exceptional 4.6% |
| Finns | 98.2 /100 | #78 | Exceptional 4.6% |
| Sri Lankans | 98.1 /100 | #79 | Exceptional 4.6% |
Demographics Similar to Paiute by Unemployment Among Ages 55 to 59 years
In terms of unemployment among ages 55 to 59 years, the demographic groups most similar to Paiute are Navajo (6.7%, a difference of 0.52%), Colville (6.7%, a difference of 0.67%), Pueblo (6.7%, a difference of 0.85%), Immigrants from Yemen (6.9%, a difference of 1.9%), and Pima (6.6%, a difference of 2.1%).
| Demographics | Rating | Rank | Unemployment Among Ages 55 to 59 years |
| Alaska Natives | 0.0 /100 | #330 | Tragic 6.2% |
| Immigrants | Dominican Republic | 0.0 /100 | #331 | Tragic 6.3% |
| Aleuts | 0.0 /100 | #332 | Tragic 6.4% |
| Pima | 0.0 /100 | #333 | Tragic 6.6% |
| Pueblo | 0.0 /100 | #334 | Tragic 6.7% |
| Colville | 0.0 /100 | #335 | Tragic 6.7% |
| Navajo | 0.0 /100 | #336 | Tragic 6.7% |
| Paiute | 0.0 /100 | #337 | Tragic 6.8% |
| Immigrants | Yemen | 0.0 /100 | #338 | Tragic 6.9% |
| Puerto Ricans | 0.0 /100 | #339 | Tragic 7.0% |
| Alaskan Athabascans | 0.0 /100 | #340 | Tragic 7.1% |
| Shoshone | 0.0 /100 | #341 | Tragic 7.4% |
| Hopi | 0.0 /100 | #342 | Tragic 8.1% |
| Yakama | 0.0 /100 | #343 | Tragic 8.9% |
| Inupiat | 0.0 /100 | #344 | Tragic 9.0% |