Immigrants from Switzerland vs Immigrants from Turkey Unemployment Among Ages 25 to 29 years
COMPARE
Immigrants from Switzerland
Immigrants from Turkey
Unemployment Among Ages 25 to 29 years
Unemployment Among Ages 25 to 29 years Comparison
Immigrants from Switzerland
Immigrants from Turkey
6.3%
UNEMPLOYMENT AMONG AGES 25 TO 29 YEARS
96.0/ 100
METRIC RATING
79th/ 347
METRIC RANK
6.2%
UNEMPLOYMENT AMONG AGES 25 TO 29 YEARS
98.9/ 100
METRIC RATING
52nd/ 347
METRIC RANK
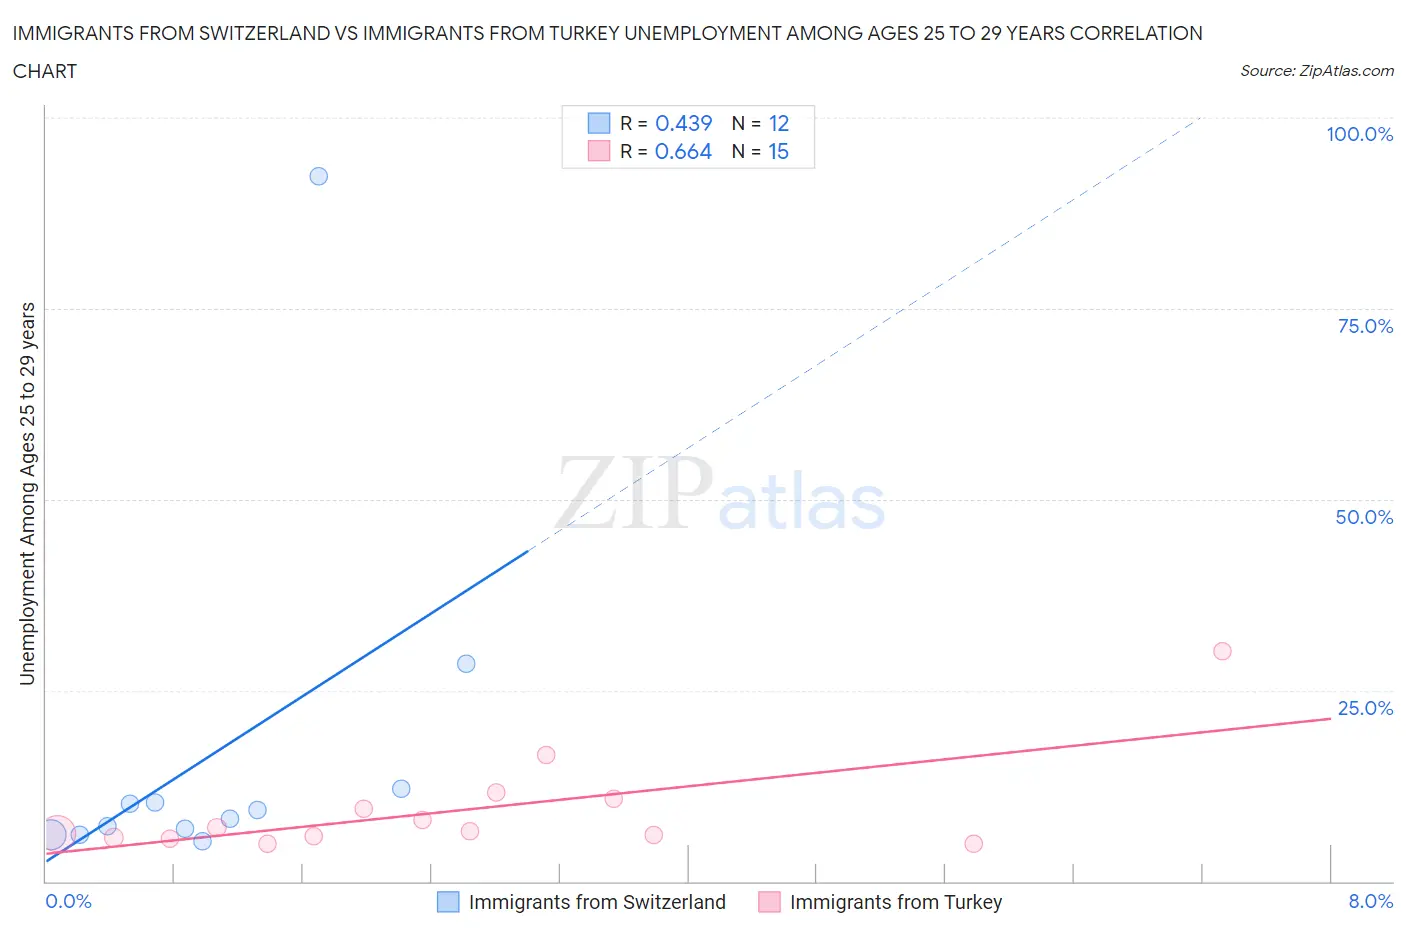
Immigrants from Switzerland vs Immigrants from Turkey Unemployment Among Ages 25 to 29 years Correlation Chart
The statistical analysis conducted on geographies consisting of 144,055,678 people shows a moderate positive correlation between the proportion of Immigrants from Switzerland and unemployment rate among population between the ages 25 and 29 in the United States with a correlation coefficient (R) of 0.439 and weighted average of 6.3%. Similarly, the statistical analysis conducted on geographies consisting of 216,805,858 people shows a significant positive correlation between the proportion of Immigrants from Turkey and unemployment rate among population between the ages 25 and 29 in the United States with a correlation coefficient (R) of 0.664 and weighted average of 6.2%, a difference of 2.1%.
Unemployment Among Ages 25 to 29 years Correlation Summary
| Measurement | Immigrants from Switzerland | Immigrants from Turkey |
| Minimum | 5.3% | 4.9% |
| Maximum | 92.3% | 30.1% |
| Range | 87.0% | 25.2% |
| Mean | 16.9% | 9.3% |
| Median | 8.7% | 6.6% |
| Interquartile 25% (IQ1) | 6.5% | 5.7% |
| Interquartile 75% (IQ3) | 11.2% | 10.8% |
| Interquartile Range (IQR) | 4.7% | 5.1% |
| Standard Deviation (Sample) | 24.5% | 6.6% |
| Standard Deviation (Population) | 23.5% | 6.3% |
Similar Demographics by Unemployment Among Ages 25 to 29 years
Demographics Similar to Immigrants from Switzerland by Unemployment Among Ages 25 to 29 years
In terms of unemployment among ages 25 to 29 years, the demographic groups most similar to Immigrants from Switzerland are Immigrants from Romania (6.3%, a difference of 0.060%), Iranian (6.3%, a difference of 0.10%), Immigrants from Poland (6.3%, a difference of 0.14%), Asian (6.3%, a difference of 0.17%), and Icelander (6.3%, a difference of 0.27%).
| Demographics | Rating | Rank | Unemployment Among Ages 25 to 29 years |
| Scandinavians | 97.4 /100 | #72 | Exceptional 6.3% |
| Belgians | 97.0 /100 | #73 | Exceptional 6.3% |
| Carpatho Rusyns | 96.9 /100 | #74 | Exceptional 6.3% |
| Immigrants | Jordan | 96.8 /100 | #75 | Exceptional 6.3% |
| Immigrants | Korea | 96.7 /100 | #76 | Exceptional 6.3% |
| Icelanders | 96.6 /100 | #77 | Exceptional 6.3% |
| Asians | 96.4 /100 | #78 | Exceptional 6.3% |
| Immigrants | Switzerland | 96.0 /100 | #79 | Exceptional 6.3% |
| Immigrants | Romania | 95.9 /100 | #80 | Exceptional 6.3% |
| Iranians | 95.8 /100 | #81 | Exceptional 6.3% |
| Immigrants | Poland | 95.7 /100 | #82 | Exceptional 6.3% |
| Slovenes | 95.3 /100 | #83 | Exceptional 6.3% |
| Immigrants | Spain | 95.2 /100 | #84 | Exceptional 6.3% |
| Immigrants | Sweden | 95.1 /100 | #85 | Exceptional 6.3% |
| Immigrants | Asia | 94.9 /100 | #86 | Exceptional 6.3% |
Demographics Similar to Immigrants from Turkey by Unemployment Among Ages 25 to 29 years
In terms of unemployment among ages 25 to 29 years, the demographic groups most similar to Immigrants from Turkey are Burmese (6.2%, a difference of 0.050%), Turkish (6.2%, a difference of 0.060%), Soviet Union (6.2%, a difference of 0.080%), Swedish (6.2%, a difference of 0.080%), and German Russian (6.2%, a difference of 0.14%).
| Demographics | Rating | Rank | Unemployment Among Ages 25 to 29 years |
| Venezuelans | 99.1 /100 | #45 | Exceptional 6.2% |
| Immigrants | Lithuania | 99.0 /100 | #46 | Exceptional 6.2% |
| Latvians | 99.0 /100 | #47 | Exceptional 6.2% |
| Immigrants | Australia | 99.0 /100 | #48 | Exceptional 6.2% |
| German Russians | 99.0 /100 | #49 | Exceptional 6.2% |
| Soviet Union | 98.9 /100 | #50 | Exceptional 6.2% |
| Burmese | 98.9 /100 | #51 | Exceptional 6.2% |
| Immigrants | Turkey | 98.9 /100 | #52 | Exceptional 6.2% |
| Turks | 98.8 /100 | #53 | Exceptional 6.2% |
| Swedes | 98.8 /100 | #54 | Exceptional 6.2% |
| Immigrants | Netherlands | 98.7 /100 | #55 | Exceptional 6.2% |
| Immigrants | Burma/Myanmar | 98.7 /100 | #56 | Exceptional 6.2% |
| Immigrants | Saudi Arabia | 98.6 /100 | #57 | Exceptional 6.2% |
| Immigrants | Eastern Asia | 98.4 /100 | #58 | Exceptional 6.2% |
| Luxembourgers | 98.3 /100 | #59 | Exceptional 6.2% |