Immigrants from Switzerland vs Immigrants from Eastern Asia Unemployment Among Ages 25 to 29 years
COMPARE
Immigrants from Switzerland
Immigrants from Eastern Asia
Unemployment Among Ages 25 to 29 years
Unemployment Among Ages 25 to 29 years Comparison
Immigrants from Switzerland
Immigrants from Eastern Asia
6.3%
UNEMPLOYMENT AMONG AGES 25 TO 29 YEARS
96.0/ 100
METRIC RATING
79th/ 347
METRIC RANK
6.2%
UNEMPLOYMENT AMONG AGES 25 TO 29 YEARS
98.4/ 100
METRIC RATING
58th/ 347
METRIC RANK
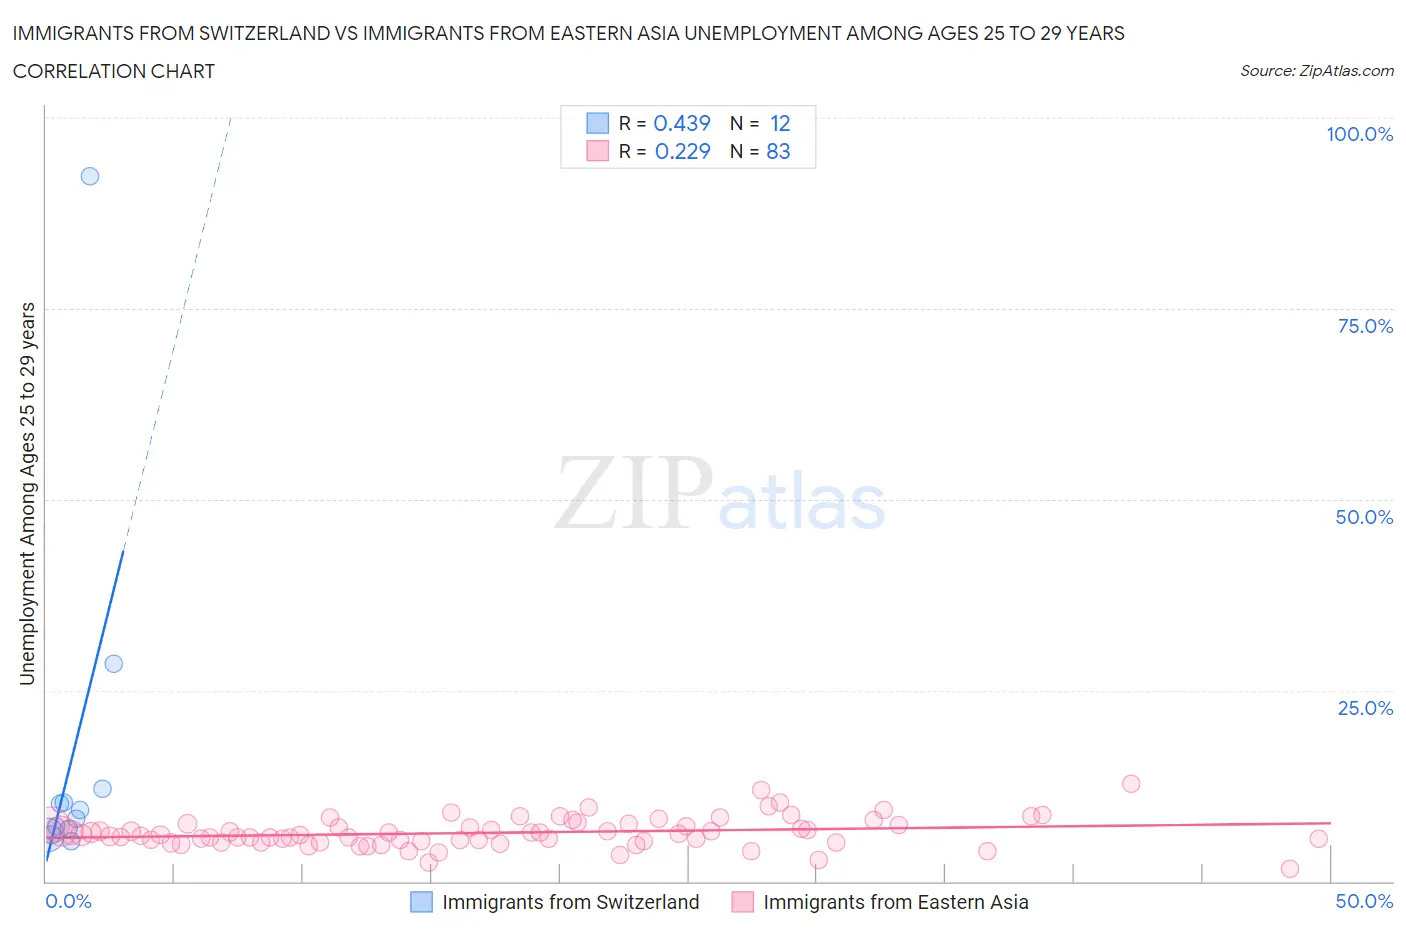
Immigrants from Switzerland vs Immigrants from Eastern Asia Unemployment Among Ages 25 to 29 years Correlation Chart
The statistical analysis conducted on geographies consisting of 144,055,678 people shows a moderate positive correlation between the proportion of Immigrants from Switzerland and unemployment rate among population between the ages 25 and 29 in the United States with a correlation coefficient (R) of 0.439 and weighted average of 6.3%. Similarly, the statistical analysis conducted on geographies consisting of 463,815,743 people shows a weak positive correlation between the proportion of Immigrants from Eastern Asia and unemployment rate among population between the ages 25 and 29 in the United States with a correlation coefficient (R) of 0.229 and weighted average of 6.2%, a difference of 1.6%.
Unemployment Among Ages 25 to 29 years Correlation Summary
| Measurement | Immigrants from Switzerland | Immigrants from Eastern Asia |
| Minimum | 5.3% | 1.7% |
| Maximum | 92.3% | 12.7% |
| Range | 87.0% | 11.0% |
| Mean | 16.9% | 6.4% |
| Median | 8.7% | 6.1% |
| Interquartile 25% (IQ1) | 6.5% | 5.2% |
| Interquartile 75% (IQ3) | 11.2% | 7.4% |
| Interquartile Range (IQR) | 4.7% | 2.2% |
| Standard Deviation (Sample) | 24.5% | 1.9% |
| Standard Deviation (Population) | 23.5% | 1.9% |
Similar Demographics by Unemployment Among Ages 25 to 29 years
Demographics Similar to Immigrants from Switzerland by Unemployment Among Ages 25 to 29 years
In terms of unemployment among ages 25 to 29 years, the demographic groups most similar to Immigrants from Switzerland are Immigrants from Romania (6.3%, a difference of 0.060%), Iranian (6.3%, a difference of 0.10%), Immigrants from Poland (6.3%, a difference of 0.14%), Asian (6.3%, a difference of 0.17%), and Icelander (6.3%, a difference of 0.27%).
| Demographics | Rating | Rank | Unemployment Among Ages 25 to 29 years |
| Scandinavians | 97.4 /100 | #72 | Exceptional 6.3% |
| Belgians | 97.0 /100 | #73 | Exceptional 6.3% |
| Carpatho Rusyns | 96.9 /100 | #74 | Exceptional 6.3% |
| Immigrants | Jordan | 96.8 /100 | #75 | Exceptional 6.3% |
| Immigrants | Korea | 96.7 /100 | #76 | Exceptional 6.3% |
| Icelanders | 96.6 /100 | #77 | Exceptional 6.3% |
| Asians | 96.4 /100 | #78 | Exceptional 6.3% |
| Immigrants | Switzerland | 96.0 /100 | #79 | Exceptional 6.3% |
| Immigrants | Romania | 95.9 /100 | #80 | Exceptional 6.3% |
| Iranians | 95.8 /100 | #81 | Exceptional 6.3% |
| Immigrants | Poland | 95.7 /100 | #82 | Exceptional 6.3% |
| Slovenes | 95.3 /100 | #83 | Exceptional 6.3% |
| Immigrants | Spain | 95.2 /100 | #84 | Exceptional 6.3% |
| Immigrants | Sweden | 95.1 /100 | #85 | Exceptional 6.3% |
| Immigrants | Asia | 94.9 /100 | #86 | Exceptional 6.3% |
Demographics Similar to Immigrants from Eastern Asia by Unemployment Among Ages 25 to 29 years
In terms of unemployment among ages 25 to 29 years, the demographic groups most similar to Immigrants from Eastern Asia are Luxembourger (6.2%, a difference of 0.13%), Immigrants from Taiwan (6.2%, a difference of 0.15%), Immigrants from Saudi Arabia (6.2%, a difference of 0.16%), Immigrants from Burma/Myanmar (6.2%, a difference of 0.25%), and Immigrants from Netherlands (6.2%, a difference of 0.27%).
| Demographics | Rating | Rank | Unemployment Among Ages 25 to 29 years |
| Burmese | 98.9 /100 | #51 | Exceptional 6.2% |
| Immigrants | Turkey | 98.9 /100 | #52 | Exceptional 6.2% |
| Turks | 98.8 /100 | #53 | Exceptional 6.2% |
| Swedes | 98.8 /100 | #54 | Exceptional 6.2% |
| Immigrants | Netherlands | 98.7 /100 | #55 | Exceptional 6.2% |
| Immigrants | Burma/Myanmar | 98.7 /100 | #56 | Exceptional 6.2% |
| Immigrants | Saudi Arabia | 98.6 /100 | #57 | Exceptional 6.2% |
| Immigrants | Eastern Asia | 98.4 /100 | #58 | Exceptional 6.2% |
| Luxembourgers | 98.3 /100 | #59 | Exceptional 6.2% |
| Immigrants | Taiwan | 98.3 /100 | #60 | Exceptional 6.2% |
| Bhutanese | 98.2 /100 | #61 | Exceptional 6.2% |
| Immigrants | China | 98.1 /100 | #62 | Exceptional 6.2% |
| Kenyans | 98.0 /100 | #63 | Exceptional 6.3% |
| Immigrants | Sri Lanka | 97.9 /100 | #64 | Exceptional 6.3% |
| Immigrants | Lebanon | 97.8 /100 | #65 | Exceptional 6.3% |