Immigrants from Switzerland vs Immigrants from Turkey High School Diploma
COMPARE
Immigrants from Switzerland
Immigrants from Turkey
High School Diploma
High School Diploma Comparison
Immigrants from Switzerland
Immigrants from Turkey
90.8%
HIGH SCHOOL DIPLOMA
99.3/ 100
METRIC RATING
81st/ 347
METRIC RANK
90.6%
HIGH SCHOOL DIPLOMA
98.9/ 100
METRIC RATING
87th/ 347
METRIC RANK
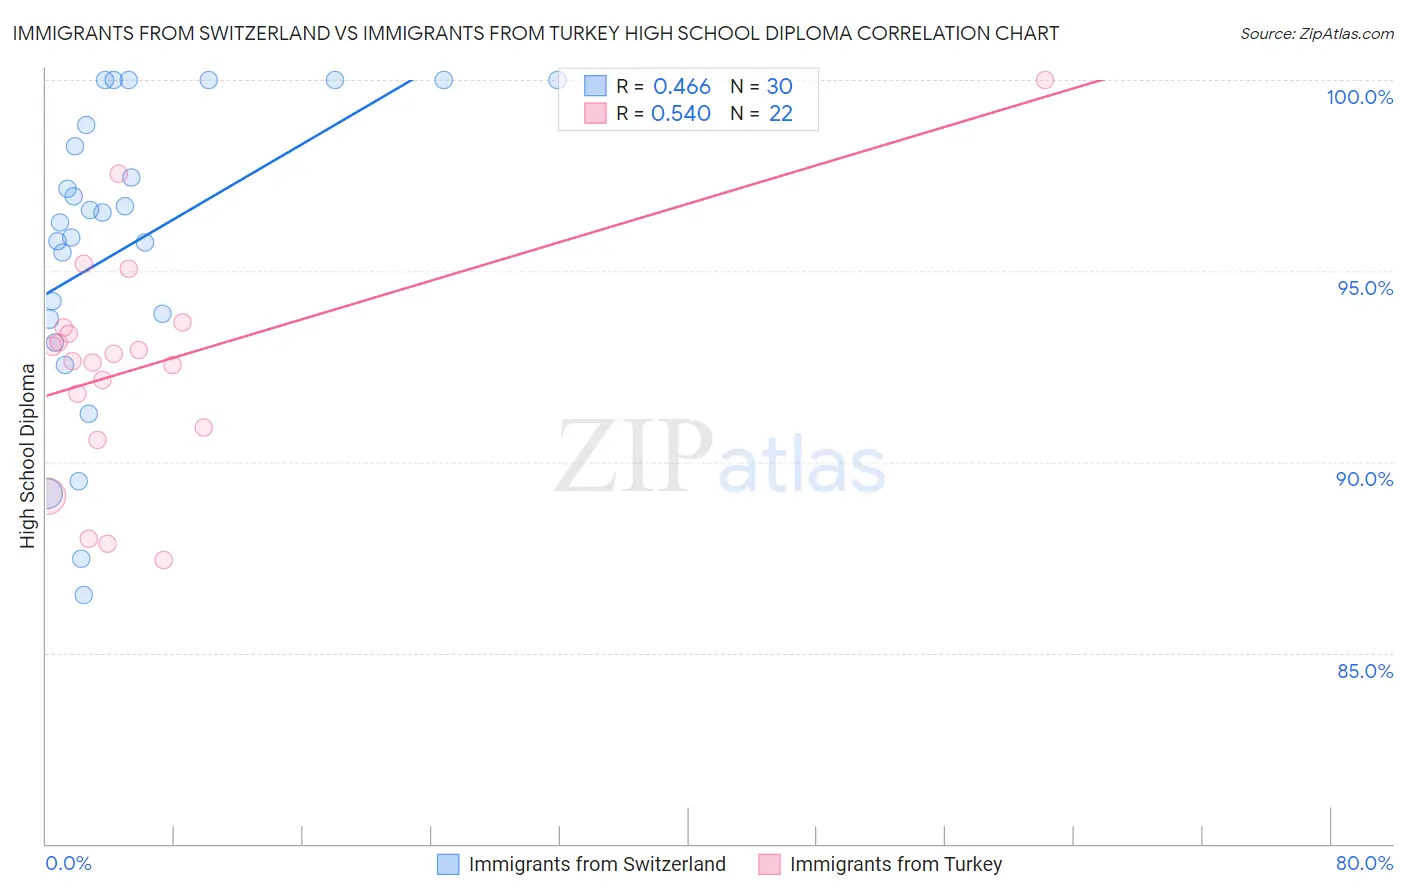
Immigrants from Switzerland vs Immigrants from Turkey High School Diploma Correlation Chart
The statistical analysis conducted on geographies consisting of 148,083,583 people shows a moderate positive correlation between the proportion of Immigrants from Switzerland and percentage of population with at least high school diploma education in the United States with a correlation coefficient (R) of 0.466 and weighted average of 90.8%. Similarly, the statistical analysis conducted on geographies consisting of 223,057,877 people shows a substantial positive correlation between the proportion of Immigrants from Turkey and percentage of population with at least high school diploma education in the United States with a correlation coefficient (R) of 0.540 and weighted average of 90.6%, a difference of 0.17%.
High School Diploma Correlation Summary
| Measurement | Immigrants from Switzerland | Immigrants from Turkey |
| Minimum | 86.5% | 87.4% |
| Maximum | 100.0% | 100.0% |
| Range | 13.5% | 12.6% |
| Mean | 95.6% | 92.5% |
| Median | 96.4% | 92.7% |
| Interquartile 25% (IQ1) | 93.7% | 90.9% |
| Interquartile 75% (IQ3) | 98.8% | 93.5% |
| Interquartile Range (IQR) | 5.1% | 2.6% |
| Standard Deviation (Sample) | 3.9% | 3.0% |
| Standard Deviation (Population) | 3.8% | 2.9% |
Demographics Similar to Immigrants from Switzerland and Immigrants from Turkey by High School Diploma
In terms of high school diploma, the demographic groups most similar to Immigrants from Switzerland are Immigrants from England (90.8%, a difference of 0.0%), Immigrants from Denmark (90.8%, a difference of 0.010%), Native Hawaiian (90.8%, a difference of 0.020%), Burmese (90.8%, a difference of 0.020%), and Hungarian (90.8%, a difference of 0.030%). Similarly, the demographic groups most similar to Immigrants from Turkey are Immigrants from Bulgaria (90.6%, a difference of 0.0%), Romanian (90.7%, a difference of 0.010%), Immigrants from France (90.6%, a difference of 0.020%), Canadian (90.6%, a difference of 0.040%), and Celtic (90.6%, a difference of 0.050%).
| Demographics | Rating | Rank | High School Diploma |
| Immigrants | Czechoslovakia | 99.4 /100 | #74 | Exceptional 90.9% |
| Cambodians | 99.4 /100 | #75 | Exceptional 90.8% |
| Hungarians | 99.3 /100 | #76 | Exceptional 90.8% |
| Native Hawaiians | 99.3 /100 | #77 | Exceptional 90.8% |
| Burmese | 99.3 /100 | #78 | Exceptional 90.8% |
| Immigrants | Denmark | 99.3 /100 | #79 | Exceptional 90.8% |
| Immigrants | England | 99.3 /100 | #80 | Exceptional 90.8% |
| Immigrants | Switzerland | 99.3 /100 | #81 | Exceptional 90.8% |
| Scotch-Irish | 99.2 /100 | #82 | Exceptional 90.8% |
| Immigrants | Moldova | 99.2 /100 | #83 | Exceptional 90.7% |
| Immigrants | Saudi Arabia | 99.1 /100 | #84 | Exceptional 90.7% |
| Romanians | 98.9 /100 | #85 | Exceptional 90.7% |
| Immigrants | Bulgaria | 98.9 /100 | #86 | Exceptional 90.6% |
| Immigrants | Turkey | 98.9 /100 | #87 | Exceptional 90.6% |
| Immigrants | France | 98.8 /100 | #88 | Exceptional 90.6% |
| Canadians | 98.7 /100 | #89 | Exceptional 90.6% |
| Celtics | 98.7 /100 | #90 | Exceptional 90.6% |
| South Africans | 98.6 /100 | #91 | Exceptional 90.6% |
| Swiss | 98.6 /100 | #92 | Exceptional 90.6% |
| Immigrants | Western Europe | 98.6 /100 | #93 | Exceptional 90.6% |
| Immigrants | Israel | 98.5 /100 | #94 | Exceptional 90.5% |