Honduran vs Immigrants from Turkey Unemployment Among Ages 25 to 29 years
COMPARE
Honduran
Immigrants from Turkey
Unemployment Among Ages 25 to 29 years
Unemployment Among Ages 25 to 29 years Comparison
Hondurans
Immigrants from Turkey
7.1%
UNEMPLOYMENT AMONG AGES 25 TO 29 YEARS
1.8/ 100
METRIC RATING
238th/ 347
METRIC RANK
6.2%
UNEMPLOYMENT AMONG AGES 25 TO 29 YEARS
98.9/ 100
METRIC RATING
52nd/ 347
METRIC RANK
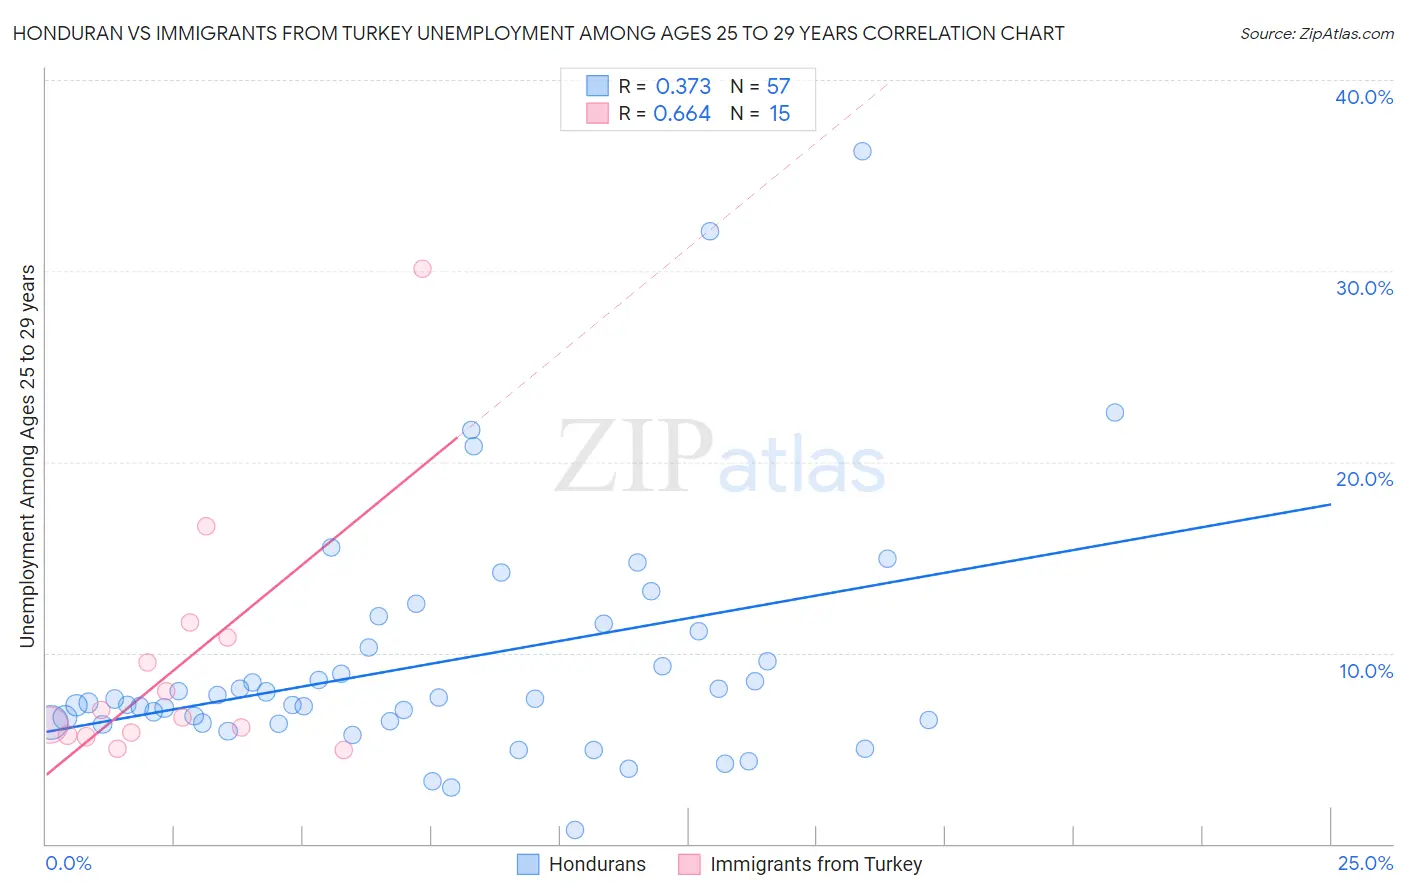
Honduran vs Immigrants from Turkey Unemployment Among Ages 25 to 29 years Correlation Chart
The statistical analysis conducted on geographies consisting of 345,754,458 people shows a mild positive correlation between the proportion of Hondurans and unemployment rate among population between the ages 25 and 29 in the United States with a correlation coefficient (R) of 0.373 and weighted average of 7.1%. Similarly, the statistical analysis conducted on geographies consisting of 216,805,858 people shows a significant positive correlation between the proportion of Immigrants from Turkey and unemployment rate among population between the ages 25 and 29 in the United States with a correlation coefficient (R) of 0.664 and weighted average of 6.2%, a difference of 14.0%.
Unemployment Among Ages 25 to 29 years Correlation Summary
| Measurement | Honduran | Immigrants from Turkey |
| Minimum | 0.70% | 4.9% |
| Maximum | 36.3% | 30.1% |
| Range | 35.6% | 25.2% |
| Mean | 9.5% | 9.3% |
| Median | 7.6% | 6.6% |
| Interquartile 25% (IQ1) | 6.4% | 5.7% |
| Interquartile 75% (IQ3) | 10.7% | 10.8% |
| Interquartile Range (IQR) | 4.3% | 5.1% |
| Standard Deviation (Sample) | 6.4% | 6.6% |
| Standard Deviation (Population) | 6.4% | 6.3% |
Similar Demographics by Unemployment Among Ages 25 to 29 years
Demographics Similar to Hondurans by Unemployment Among Ages 25 to 29 years
In terms of unemployment among ages 25 to 29 years, the demographic groups most similar to Hondurans are Puget Sound Salish (7.1%, a difference of 0.020%), Cape Verdean (7.0%, a difference of 0.090%), Panamanian (7.0%, a difference of 0.23%), French Canadian (7.0%, a difference of 0.39%), and Immigrants from Honduras (7.0%, a difference of 0.41%).
| Demographics | Rating | Rank | Unemployment Among Ages 25 to 29 years |
| Central Americans | 3.0 /100 | #231 | Tragic 7.0% |
| Spanish Americans | 2.7 /100 | #232 | Tragic 7.0% |
| Immigrants | Honduras | 2.4 /100 | #233 | Tragic 7.0% |
| French Canadians | 2.4 /100 | #234 | Tragic 7.0% |
| Panamanians | 2.1 /100 | #235 | Tragic 7.0% |
| Cape Verdeans | 1.9 /100 | #236 | Tragic 7.0% |
| Puget Sound Salish | 1.8 /100 | #237 | Tragic 7.1% |
| Hondurans | 1.8 /100 | #238 | Tragic 7.1% |
| Potawatomi | 1.3 /100 | #239 | Tragic 7.1% |
| Native Hawaiians | 1.3 /100 | #240 | Tragic 7.1% |
| Immigrants | Sierra Leone | 1.3 /100 | #241 | Tragic 7.1% |
| Spanish American Indians | 1.1 /100 | #242 | Tragic 7.1% |
| Yaqui | 1.0 /100 | #243 | Tragic 7.1% |
| Immigrants | Nonimmigrants | 0.9 /100 | #244 | Tragic 7.1% |
| Guatemalans | 0.9 /100 | #245 | Tragic 7.1% |
Demographics Similar to Immigrants from Turkey by Unemployment Among Ages 25 to 29 years
In terms of unemployment among ages 25 to 29 years, the demographic groups most similar to Immigrants from Turkey are Burmese (6.2%, a difference of 0.050%), Turkish (6.2%, a difference of 0.060%), Soviet Union (6.2%, a difference of 0.080%), Swedish (6.2%, a difference of 0.080%), and German Russian (6.2%, a difference of 0.14%).
| Demographics | Rating | Rank | Unemployment Among Ages 25 to 29 years |
| Venezuelans | 99.1 /100 | #45 | Exceptional 6.2% |
| Immigrants | Lithuania | 99.0 /100 | #46 | Exceptional 6.2% |
| Latvians | 99.0 /100 | #47 | Exceptional 6.2% |
| Immigrants | Australia | 99.0 /100 | #48 | Exceptional 6.2% |
| German Russians | 99.0 /100 | #49 | Exceptional 6.2% |
| Soviet Union | 98.9 /100 | #50 | Exceptional 6.2% |
| Burmese | 98.9 /100 | #51 | Exceptional 6.2% |
| Immigrants | Turkey | 98.9 /100 | #52 | Exceptional 6.2% |
| Turks | 98.8 /100 | #53 | Exceptional 6.2% |
| Swedes | 98.8 /100 | #54 | Exceptional 6.2% |
| Immigrants | Netherlands | 98.7 /100 | #55 | Exceptional 6.2% |
| Immigrants | Burma/Myanmar | 98.7 /100 | #56 | Exceptional 6.2% |
| Immigrants | Saudi Arabia | 98.6 /100 | #57 | Exceptional 6.2% |
| Immigrants | Eastern Asia | 98.4 /100 | #58 | Exceptional 6.2% |
| Luxembourgers | 98.3 /100 | #59 | Exceptional 6.2% |